International Journal of Management Science and Business Administration
Volume 12, Issue 3, May 2026, Pages 7-26
Healthcare Workers Adaptation to Industry 4.0 Technologies and Use Intentions: An Integrated Research Using Latent Class Analysis, Multi-Group SEM, and ANN
URL: https://doi.org/10.18775/ijmsba.1849-5664-5419.2014
DOI:
1Ali Guliyev, 2Beran Gülçiçek Tolun,
1Ali Guliyev, Celal Bayar University, Manisa, Institute of Postgraduate Education, Department of Business Administration E-mail: aliguliyev10@gmail.com. ORCID: 0000-0001-5592-0187
2Assistant Professor, Department of Business Administration, Faculty of Economics and Administrative Sciences, Celal Bayar University, Manisa. ORCID: 0000-0002-7552-2351

Abstract: This study examines the adaptation processes and usage intentions regarding Industry 4.0 technologies among 402 healthcare professionals (doctors, nurses, and care assistants) working in various healthcare institutions in Azerbaijan within a comprehensive methodological framework. This study proposes an extended model based on the Technology Acceptance Model (TAM) and the Unified Theory of Acceptance and Use of Technology (UTAUT) and tests this model using four complementary econometric methods: PLS-SEM using SmartPLS 4.0, Latent Class Analysis (LCA) using Stata 19, Multi-Group Structural Equation Modelling (MGSEM) using R/lavaan, and Artificial Neural Networks (ANN) using Python.
In the PLS-SEM analysis, all six hypotheses tested with 5,000 bootstrap samples were supported at the p<0.01 level, an excellent model fit was achieved with an SRMR of 0.036. The strongest path was identified as ATT-BI (β=0.700, f²=0.962).
In the first stage, Latent Class Analysis (LCA) was applied using the gsem command in Stata 19 software, and the existence of three distinct technology acceptance profiles among healthcare workers was identified: Reluctant Users (42.8%, n=172), Willing but Unable Users (29.6%, n=119) and Active Users (27.6%, n=111). The model selection criteria (BIC₃=9895 < BIC₂=10216) supported the three-class solution. Gender was identified as the sole demographic variable significantly predicting class membership (χ²=11.71, p=0.003), with female healthcare workers disproportionately concentrated in the Willing but Unable Users class (71.4%). In the third phase of the study, Multi-Group Structural Equation Modelling (MGSEM) was utilised for each Latent Class Analysis (LCA) category using the lavaan package in R software. The structural path invariance test revealed significant differences in the structural paths among the groups (χ²=31.65, df=16, p=0.011). Significant predictors were identified as Perceived Usefulness for Reluctant Users (β=0.258, p=0.001), DYNK (Facilitating Conditions) for Willing but Unable Users (β=0.265, p=0.009), and support (β=0.400, p<0.001) and experience (β=-0.318, p<0.001) for Active Users. In the fourth phase, an Artificial Neural Network (ANN) analysis was conducted using Python’s scikit-learn library. The variable importance scores, calculated using the Garson method, were consistent with the SEM findings, demonstrating concordance between the MGSEM and ANN regarding the critical variables. The ANN model exhibited substantial explanatory power, particularly in the Willing but Unable Users (R²=0.546) and active (R²=0.698) categories. The findings suggest that healthcare workers do not constitute a homogeneous group, that technology acceptance mechanisms vary by category, and that organizational support (DYNK (Facilitating Conditions)) is a critical determinant, especially for workers willing to adopt technology but facing organizational barriers to its use. This study contributes to the literature on health technology acceptance both methodologically, through the integration of four complementary methods: PLS-SEM, LCA, MGSEM, and ANN, and theoretically, through the consideration of class-based heterogeneity.
Keywords: Industry 4.0, Health Technology, TAM, UTAUT, Latent Class Analysis, ANN, PLS-SEM
1. Introduction
Industry 4.0, also known as the Fourth Industrial Revolution, is driving substantial social and economic transformations through the integration of digital technologies such as artificial intelligence, the Internet of Things (IoT), big data analytics, robotics, and blockchain. These technological advancements have significantly impacted the healthcare sector, offering both opportunities and challenges. Health information systems, diagnostic support algorithms, remote patient monitoring platforms, and electronic health record systems increasingly depend on clinicians' adoption of Industry 4.0 technologies. The literature on technology acceptance has developed various theoretical frameworks to elucidate the processes by which individuals adopt new technology. The Technology Acceptance Model (TAM), introduced by Davis (1989), identifies perceived usefulness and perceived ease of use as the primary predictors of behavioural intention. The Unified Theory of Acceptance and Use of Technology (UTAUT), developed by Venkatesh et al. (2003), provides a more comprehensive framework based on four main constructs: performance expectancy, effort expectancy, social influence, and facilitating conditions. Nonetheless, the debate persists regarding whether these models adequately capture the unique dynamics of the healthcare sector. Most current studies employ cross-sectional survey data and standard structural equation modelling (SEM). However, this approach has several limitations. First, standard SEM treats the entire sample as a homogeneous entity, overlooking the potential existence of differentiated subgroups. Second, standard SEM models only linear relationships, failing to capture potential nonlinear patterns between variables. Third, studies that consider healthcare workers as a heterogeneous population comprising different occupational groups, such as doctors, nurses, and care workers, remain exceedingly limited. Designed to address this gap, the present study proposes an innovative methodology integrating four complementary econometric methods: 1) PLS-SEM to test the TAM/UTAUT theoretical model, 2) Latent Class Analysis (LCA), 3) Multi-Group SEM to test whether structural paths differ across classes, and 4) Artificial Neural Networks (ANN) to measure non-linear variable importance. This methodological approach allowed the research questions to be addressed at a depth that existing studies in the literature have been unable to achieve. The main contributions of this study can be summarised as follows: 1) Empirically demonstrating the existence of latent heterogeneity in Industry 4.0 technology adoption behaviour among healthcare workers in Azerbaijan; 2) developing a multi-layered methodological framework through the integration of PLS-SEM, LCA, MGSEM, and ANN; 3) identifying points for organizational intervention, particularly through the identification of the ‘Willing but Unable’ profile; and 4) examining gender-based barriers to technology adoption among female healthcare workers.
2. Literature review
The theoretical underpinnings of technology acceptance research are rooted in Davis’s (1989) seminal work. The Technology Acceptance Model (TAM), derived from the Theory of Reasoned Action (TRA), identifies perceived usefulness and perceived ease of use as the primary determinants of individual technology adoption. The model's predictive validity has been substantiated across various contexts within the information systems discipline over several decades. Venkatesh and Davis (2000) expanded this model by incorporating additional variables, such as subjective norms, image, job relevance, and output quality, into an enhanced version known as TAM2, thereby significantly augmenting the model’s theoretical explanatory power.
The Unified Theory of Acceptance and Use of Technology (UTAUT), proposed by Venkatesh et al. (2003), introduced an integrated framework by synthesising eight distinct technology acceptance models, including the Technology Acceptance Model (TAM). This model emphasises performance expectancy, effort expectancy, social influence, and facilitating conditions as its core constructs, while identifying gender, age, experience, and voluntariness as moderator variables. Subsequently, UTAUT2, developed by Venkatesh et al. (2012), expanded the model by incorporating hedonic motivation, price value, and habit variables to better address the consumer’s context. These models continue to be the most extensively utilised frameworks in studies on health technology acceptance.
In the current study, the Technology Relations (TR) construct was derived from the Unified Theory of Acceptance and Use of Technology (UTAUT) framework to assess healthcare workers' general orientation and prior experience with technology. This construct reflects the extent to which individuals perceive technology as compatible with their professional identity and work environment, and it serves as a precursor to Perceived Usefulness (PU) in the proposed research model (H2: TR - PU).
Recent systematic reviews and meta-analyses suggest that while the Technology Acceptance Model (TAM) and the Unified Theory of Acceptance and Use of Technology (UTAUT) offer a robust framework for elucidating the adoption of health technology, they also exhibit significant limitations. Lee et al. (2025) conducted a comprehensive review, revealing that TAM and UTAUT insufficiently address context-specific elements such as trust dynamics, cultural factors, and organizational readiness. Thanthrige et al. (2025), through a meta-analysis integrating UTAUT with the Technology-Organization-Environment (TOE) model, demonstrated that facilitating conditions are among the most significant predictors for healthcare professionals.
The integration of Industry 4.0 into the healthcare sector signifies a multidimensional and multidisciplinary transformation of the healthcare sector. AI-supported diagnostic systems, electronic health records, wearable sensor technologies, IoT-based patient monitoring systems, and telemedicine applications are the most prominent aspects of this transformation. Colmenar-Santos et al. (2023), in their structural equation modelling (SEM) study involving 272 healthcare workers in high-complexity hospitals in Colombia, reported that Industry 4.0 technologies positively influenced inter-organizational collaboration and organizational performance; however, the impact on reducing patient service time was not statistically significant.
Wu et al. (2024) conducted an investigation into the technology adoption behavior of clinicians across hospitals at different hierarchical levels within medical consortia in China, utilizing the Theory of Planned Behaviour and multi-group Structural Equation Modeling (SEM). The findings indicate significant differences in the mechanisms of technology adoption between lead and affiliated hospitals, thereby justifying the theoretical application of Latent Class Analysis (LCA) in the current study. Jat et al. (2024), in their research involving healthcare professionals in India and Bhutan, examined the acceptance of remote health monitoring technology using the Technology Acceptance Model (TAM) and the Unified Theory of Acceptance and Use of Technology (UTAUT) frameworks, identifying perceived trust and organizational infrastructure as crucial factors influencing acceptance. LCA is a statistical technique used to identify unobservable, heterogeneous groups. Unlike traditional group-based analyses, such as ANOVA, LCA identifies groups in a data-driven manner rather than through pre-defined criteria. This approach is gaining increasing interest in technology acceptance research.
Staeck et al. (2024) examined the acceptance of e-mental health applications among psychotherapy trainees using LCA with UTAUT variables and found that a two-class solution provided the best model fit. Kim et al. (2025), meanwhile, examined the acceptance of transfer-assisting robots in Korea using Latent Profile Analysis (LPA); they identified three distinct profiles-low acceptance, moderate acceptance and high acceptanceand demonstrated that personal characteristics, health status and factors related to workload significantly predicted class membership.
Our current research endeavours to extend the application of Latent Class Analysis (LCA) within the domain of health technology acceptance, paralleling existing studies. A comprehensive literature review reveals that no prior study has simultaneously employed both LCA and multi-group structural equation modelling (MGSEM) in the context of Industry 4.0 technology acceptance while integrating Artificial Neural Networks (ANN) into these methodologies. Therefore, this study presents a methodological innovation, and the integration of these three complementary methods yields a more nuanced and comprehensive understanding than any single method could achieve. The combined application of partial least squares structural equation modelling (PLS-SEM) and ANN has gained significant traction in management and information systems research in recent years. The rationale for this hybrid approach is evident: SEM facilitates the examination of linear relationships and theoretical pathways, whereas ANN is adept at capturing complex nonlinear relationships among variables and assessing their importance. Hair et al. (2021) identified this approach as a prospective direction for PLS-SEM. Jiang et al. (2022) investigated the widespread adoption of e-Doctor applications in China using a SEM-ANN hybrid method within a Technology Acceptance Model (TAM)-based framework, demonstrating that the two methods yield complementary insights.
3. Research Methodology - Materials and Methods
The research model proposed in this study extends the theoretical frameworks of TAM (Davis, 1989) and UTAUT (Venkatesh et al., 2003) by integrating them into a single model. Eight independent constructs were identified in the model: Technology Relations (TR), Perceived Usefulness (PU), Perceived Ease of Use (PEOU), Attitude (ATT), Experience (EXP), Voluntariness (WILL), Facilitating Conditions (FC/DYNK), and Compatibility (COMP/UYUM). The survey instrument also included six background questions on participants’ general relationship with technology (Section C), used as descriptive information. Usage Behaviour (USE) was selected as the dependent variable.
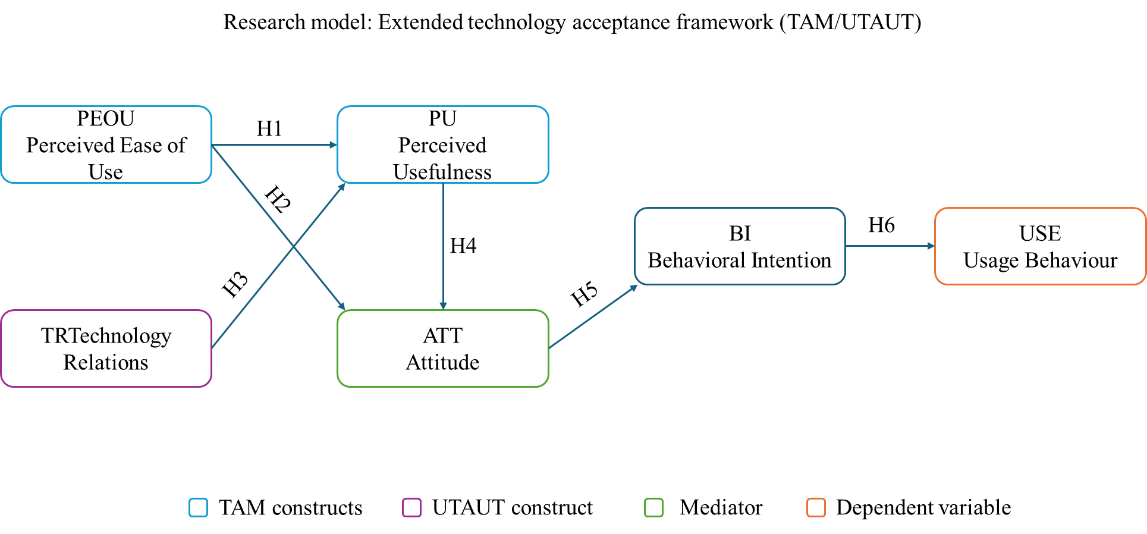
Figure 1. Research Model: The Extended Technology Acceptance Framework Based on TAM/UTAUT
The following hypotheses were formulated within the theoretical framework:
| H | Path / Statement | Theoretical Basis | Method |
| h2 | Perceived Ease of Use (PEOU) - Perceived Usefulness (PU) | TAM (Davis, 1989) | PLS-SEM |
| H2 | Technology Relations (TR) - Perceived Usefulness (PU) | UTAUT (Venkatesh et al., 2003) | PLS-SEM |
| H3 | Perceived Ease of Use (PEOU) - Attitude (ATT) | TAM (Davis, 1989) | PLS-SEM |
| H4 | Perceived Usefulness (PU) - Attitude (ATT) | TAM (Davis, 1989) | PLS-SEM |
| H5 | Attitude (ATT) - Intention to Use (BI) | Theory of Planned Behaviour | PLS-SEM |
| H6 | Intention to Use (BI) - Usage Behaviour (USE) | TAM/UTAUT | PLS-SEM |
Table 1. Research Hypotheses
Note: The six formal hypotheses (h2–H6) are tested using PLS-SEM within the TAM/UTAUT framework. The additional constructs (EXP, VOL, FC, COMP) included in the MGSEM and ANN stages represent an exploratory extension of the main model, aimed at identifying class-specific predictors beyond the theoretical core. These analyses are not hypothesis-driven but serve to uncover group-specific mechanisms.
To ensure terminological consistency throughout the manuscript, all constructs and their abbreviations are clarified here. The study employs the following constructs: Technology Relations (TR), Perceived Usefulness (PU), Perceived Ease of Use (PEOU), Attitude (ATT), Behavioural Intention (BI), and Usage Behaviour (USE), which form the core TAM/UTAUT model tested through PLS-SEM. In addition, Experience (EXP), Voluntariness (VOL), Facilitating Conditions (FC), and Compatibility (COMP) are included as exploratory predictors in the MGSEM and ANN stages. In earlier sections of the manuscript, these constructs may also appear under their original Turkish data file codes: DNYM (EXP), GNLK (VOL), DYNK (FC), and UYUM (COMP). The abbreviation AKK, which appears in Table 14, refers to PEOU (Perceived Ease of Use). All constructs were measured using five-point Likert scales (1 = Strongly Disagree, 5 = Strongly Agree).
Research Design and Sample
This study adopted a cross-sectional survey design within the framework of the quantitative research paradigm. Data were collected from 402 healthcare workers employed in state hospitals, research hospitals, city hospitals, university hospitals, oral and dental health centres, family medicine units, and private healthcare institutions in Azerbaijan. The sample consisted of 207 doctors (51.5%), 108 nurses (26.9%), and 87 care assistants (21.6%). Of the participants, 58.5% were women and 41.5% were men. An analysis of the age distribution revealed that 34.6% were aged 55 or over, while in terms of experience, 31.3% had 16 years or more of professional experience.
The questionnaire was designed using a five-point Likert scale (1 = Strongly Disagree, 5 = Strongly Agree) and consisted of 45 items. The scales were adapted from validated measurement tools in the relevant literature and tailored to the Azerbaijani healthcare system. Validity and reliability analyses were conducted using the PLS-SEM method in SmartPLS 4.0 software; it was observed that the Cronbach’s alpha values for all constructs were above 0.80, the average variance explained (AVE) values exceeded 0.50, and the composite reliability (CR) values surpassed the 0.85 threshold.
| Software | Version | Purpose | Analysis Stage |
| SPSS | 25.0 | Frequency, descriptive statistics, correlation, Harman CMB test | Preliminary Analysis |
| SmartPLS | 4.0 | PLS-SEM: measurement model (AVE, CR, HTMT), structural model, 5,000 bootstrap | Stage 1 |
| Stata | 19 | Latent Class Analysis (LCA) - the gsem command, posterior probability estimation | Stage 2 |
| R + lavaan | 4.x + 0.6-21 | Multi-group SEM, configural/ structural path invariance test, MLR estimator | Stage 3 |
| Python, scikit-learn | 3.14 + 1.8 | Artificial Neural Network (ANN): MLPRegressor, Garson variable importance, 50 seeds | Stage 4 |
Table 2. Software Used in the Study - Stage-by-Stage Summary
The four-stage methodological flow of this study is shown in Figure 2. Each stage presents the software used and the main output.
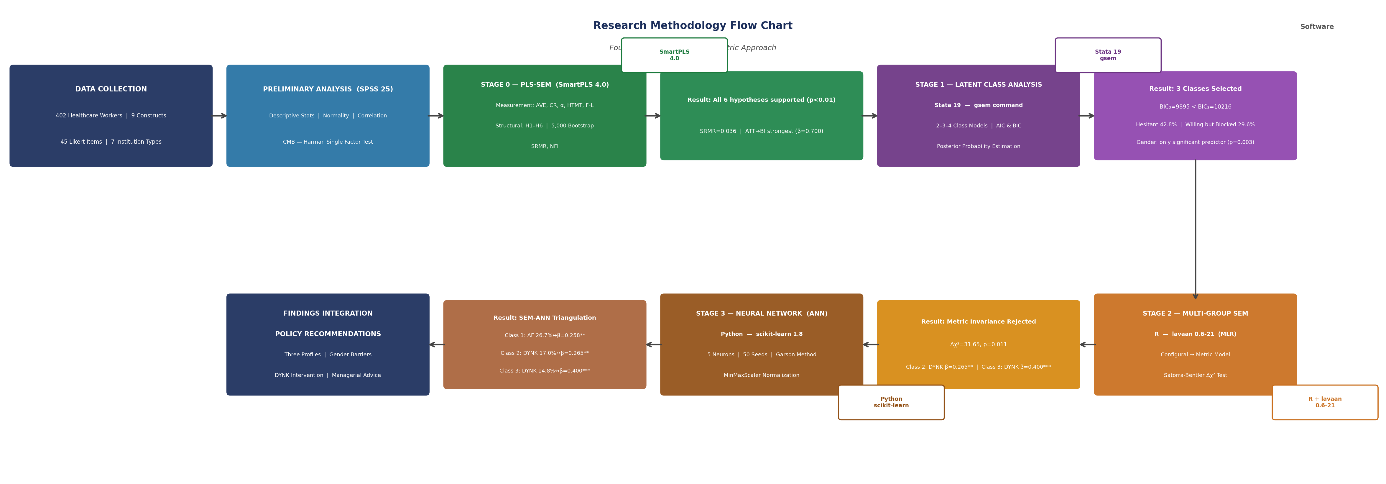
Figure 2. Research Methodology Flowchart – Four-Stage Integrated Econometric Approach
Stage 1: PLS-SEM (SmartPLS 4.0) Partial least squares structural equation modelling (PLS-SEM) was employed because of its robust estimation capabilities, effectiveness with medium-sized samples, and appropriateness for exploratory research structures. The measurement model was evaluated using the Fornell-Larker criterion and the heterotrait-monotrait (HTMT) ratio, while the structural model was assessed using 5,000 bootstrap samples. Model fit was determined using the Standardised Root Mean Square Residual (SRMR), with a threshold value of SRMR < 0.080.
Stage 2: Latent Class Analysis (LCA) (Stata 19) Latent Class Analysis (LCA) operates within a limited mixture modeling framework, designed to identify homogeneous subgroups (classes) influenced by an unobserved categorical latent variable (Collins and Lanza, 2010). Unlike traditional group-based comparisons, LCA identifies groups in a data-driven manner based on the covariance patterns of observed variables without predefined groupings by the researcher. In this study, LCA was conducted using the gsem command in Stata 19. For continuous indicators (structure mean scores), a Gaussian distribution was utilised alongside the identity link function. Two, three, and four-class models were sequentially estimated, with the optimal number of classes determined using the Akaike Information Criterion (AIC) and the Bayesian Information Criterion (BIC). The entropy measure was also considered to evaluate the uncertainty of the class membership. Following model estimation, individual posterior probability estimates (classpost class(k)) were calculated, and each participant was assigned to the class with the highest posterior probability. The relationship between class membership and demographic variables was examined using chi-square tests and multinomial logistic regression, with class membership as the dependent variable.
Stage 3: Multi-Group SEM - MGSEM (R/lavaan) Multi-Group Structural Equation Modelling (MGSEM) facilitates the comparison of structural paths across the classes identified by Latent Class Analysis (LCA). Unlike traditional Multi-Group Analysis (MGA), MGSEM utilises predefined groups, which in this context are the data-driven LCA classes. This integration represents a robust combination of exploratory and confirmatory analyses. The MGSEM was executed using the lavaan 0.6-21 package in R, employing the Maximum Likelihood (ML) estimator. Initially, a configurational model allowing unrestricted paths for each group was developed. Subsequently, a metric model that assumes equal regression coefficients across groups was tested. These models were compared to assess the measurement invariance. Cluster correction at the entity level was applied to the variance calculations. The analysis was conducted in two distinct phases: 1) Measurement invariance testing, wherein configural and metric models were compared to assess the equivalence of factor loadings across latent class analysis (LCA) classes; 2) Structural path analysis, which involved examining the regression paths from each construct to Usage Behaviour (USE) for each class individually, in order to identify predictors specific to each group.
Stage 4: ANN (Python/scikit-learn) Artificial Neural Network analysis was conducted using the scikit-learn 1.8 library in Python. The MLPRegressor class was configured with a single hidden layer comprising five neurones, utilising a sigmoid activation function and the L-BFGS optimisation method, with a maximum of 10,000 iterations. Separate models were constructed for each LCA class, and all independent and dependent variables were normalised to the range [0,1] using MinMaxScaler. Variable importance was determined using Garson’s (1991) method, which is based on the average importance derived from 50 different random starting values to enhance the stability of the model prediction. The average R² values and variable importance percentages were reported for each class. The dataset was partitioned into training (80%) and test (20%) subsets for each LCA class. Model performance was assessed using Mean Squared Error (MSE) and R² metrics on the test set. To mitigate overfitting, 50 distinct random seed values were employed, and the results were averaged to ensure the stability of the variable importance estimates.
4. Results
Demographic Profile
The demographic distribution of the 402 healthcare workers who participated in the study is presented in Table 3. Women constitute the majority (58.5%), doctors form the largest occupational group (51.5%), postgraduate/specialist training is the most common level of education (48.3%), and those aged 55 and over form the largest age group (34.6%).
| Demographic Variable | Group | n | % |
| Gender | Male | 167 | 41.54 |
| Female | 235 | 58.46 | |
| Age | Under 35 | 103 | 25.62 |
| 36–45 | 92 | 22.89 | |
| 45–54 | 68 | 16.92 | |
| 55 and over | 139 | 34.58 | |
| Marital Status | Married | 286 | 71.14 |
| Single/Divorced/Widowed | 116 | 28.86 | |
| Education | High School | 78 | 19.40 |
| Associate Degree | 20 | 4.98 | |
| Bachelor's Degree | 110 | 27.36 | |
| Master's / Specialist | 194 | 48.26 | |
| Occupational Group | Doctor | 207 | 51.49 |
| Nurse | 108 | 26.87 | |
| Care Assistant | 87 | 21.64 | |
| Professional Experience | 1–5 years | 124 | 30.85 |
| 6–10 years | 78 | 19.40 | |
| 11–15 years | 74 | 18.41 | |
| 16 years and over | 126 | 31.34 | |
| TOTAL | 402 | 100.00 |
Table 3. Demographic Profile
Descriptive Statistics
Table 4 presents the descriptive statistics and reliability coefficients for the nine constructs of the study. All values for kurtosis and skewness fall between −2 and +2, indicating that the data distribution is close to a normal distribution (George and Mallery, 2010). When a 0.80 score range was used for the five-point Likert scale, Intention to Use (BI=2.57) was ‘low’, while the other constructs remained at a ‘moderate’ level. The construct means ranged from 2.57 (BI) to 3.16 (ATT). The difference between ATTITUDE and behavioural intention points to the organisational barriers preventing the translation of attitude into action.
| Construct (Code) | Mean | Med. | Std. Dev. | Mult. | Skew | Level | Cronbach’s α |
| Technology Relations (TR) | 2.87 | 3.00 | 1.09 | 0.06 | -1.11 | Medium | 0.873 |
| Perceived Usefulness (PU) | 2.78 | 2.40 | 1.08 | 0.39 | -1.05 | Medium | 0.869 |
| Ease of Use (PEOU) | 2.99 | 3.00 | 1.06 | 0.22 | -1.15 | Medium | 0.849 |
| Attitude (ATT) | 3.16 | 3.60 | 1.05 | -0.27 | -1.44 | Medium | 0.878 |
| Intention to Use (BI) | 2.57 | 2.20 | 1.05 | 0.63 | -0.72 | Low | 0.882 |
| User Behaviour (USE) | 2.65 | 2.40 | 1.02 | 0.70 | -0.50 | Medium | 0.849 |
| Experience (EXP) | 2.89 | 3.00 | 1.14 | 0.10 | -1.08 | Medium | 0.884 |
| Volunteering (GNLK) | 2.95 | 3.00 | 1.13 | 0.15 | -1.10 | Medium | 0.896 |
| DYNK (Facilitating Conditions) | 3.00 | 3.00 | 1.08 | 0.05 | -1.09 | Medium | 0.872 |
| Adaptation (UYUM) | 3.02 | 3.00 | 1.17 | 0.08 | -1.20 | Medium | 0.888 |
Table 4. Descriptive Statistics, Normality and Reliability Coefficients (N=402)
Note: Level (Durmaz, 2020): 1–1.80 Very Low | 1.81–2.60 Low | 2.61–3.40 Moderate | 3.41–4.20 High. CMB: Harman’s first factor = 8.97% (<50%, no significant CMB).
Table 5 displays the Pearson correlation coefficients for the examined variables, with all correlations achieving statistical significance at p<0.01. The most pronounced association was between ATT and BI (r=0.618), underscoring the pivotal influence of attitude on usage intention.
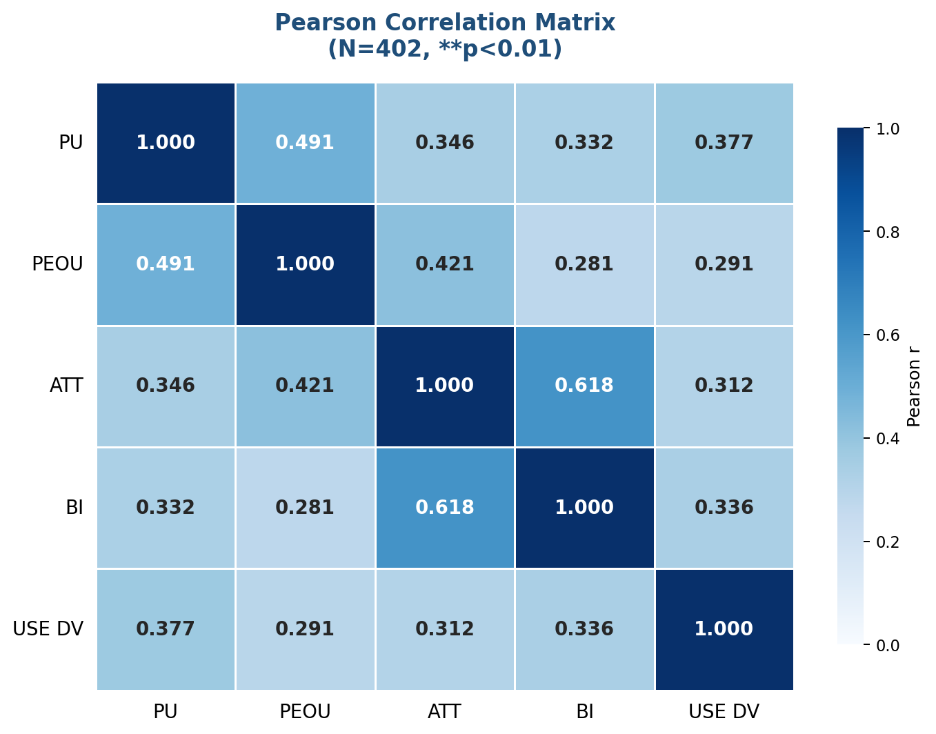
Figure 3. Pearson Correlation Heat Map (N=402, **p<0.01)
| Variable | TR | PU | PEOU | ATT | BI | USE |
| TR | 1 | .402** | .250** | .310** | .335** | .280** |
| PU | 1 | .491** | .346** | .332** | .377** | |
| PEOU | 1 | .421** | .281** | .291** | ||
| ATT | 1 | .618** | .312** | |||
| BI | 1 | .336** | ||||
| USE | 1 |
Table 5. Pearson Correlation Matrix
Note: **p<0.01. All correlations were statistically significant.
PLS-SEM Measurement Model Results
In SmartPLS 4.0, the criteria of CR > 0.70, α > 0.70, and AVE > 0.50 were met for all constructs. The factor loadings ranged from 0.585 to 0.979, and all t-values exceeded the 2.58 threshold. All HTMT values were below 0.85, and the VIF values remained below 5.0.
| Structure | Item | Factor Load | t-value | AVE | CR | Alpha | VIF |
| PU | PU1-5 | 0.707-0.835 | >2.58 | 0.571 | 0.869 | 0.869 | 1.093 |
| PEOU | PEOU1-5 | 0.585-0.979 | >2.58 | 0.527 | 0.843 | 0.849 | - |
| ATT | ATT1-5 | 0.730-0.801 | >2.58 | 0.591 | 0.878 | 0.878 | 1.490 |
| BI | BI1-5 | 0.710-0.852 | >2.58 | 0.603 | 0.883 | 0.882 | - |
| USE | USE1-5 | 0.682-0.770 | >2.58 | 0.530 | 0.849 | 0.849 | 1.000 |
| TR | TR 1-5 | 0.715-0.816 | >2.58 | 0.579 | 0.873 | 0.873 | - |
Table 6. Reliability and Validity Results of the PLS-SEM Measurement Model
Note: The criteria of AVE > 0.50, CR > 0.70, α > 0.70, HTMT < 0.85, and VIF < 5.0 have been met (Fornell and Larcker, 1981; Henseler et al., 2015).
PLS-SEM Structural Model and Hypothesis Testing
The overall fit of the structural model was assessed using the SRMR value, which was calculated as 0.036, and was found to be below the threshold value of 0.080. The NFI value of 0.862 met the >0.70 criterion. The model’s explanatory power was measured by R², while its predictive power was measured by Q² (Table 7).
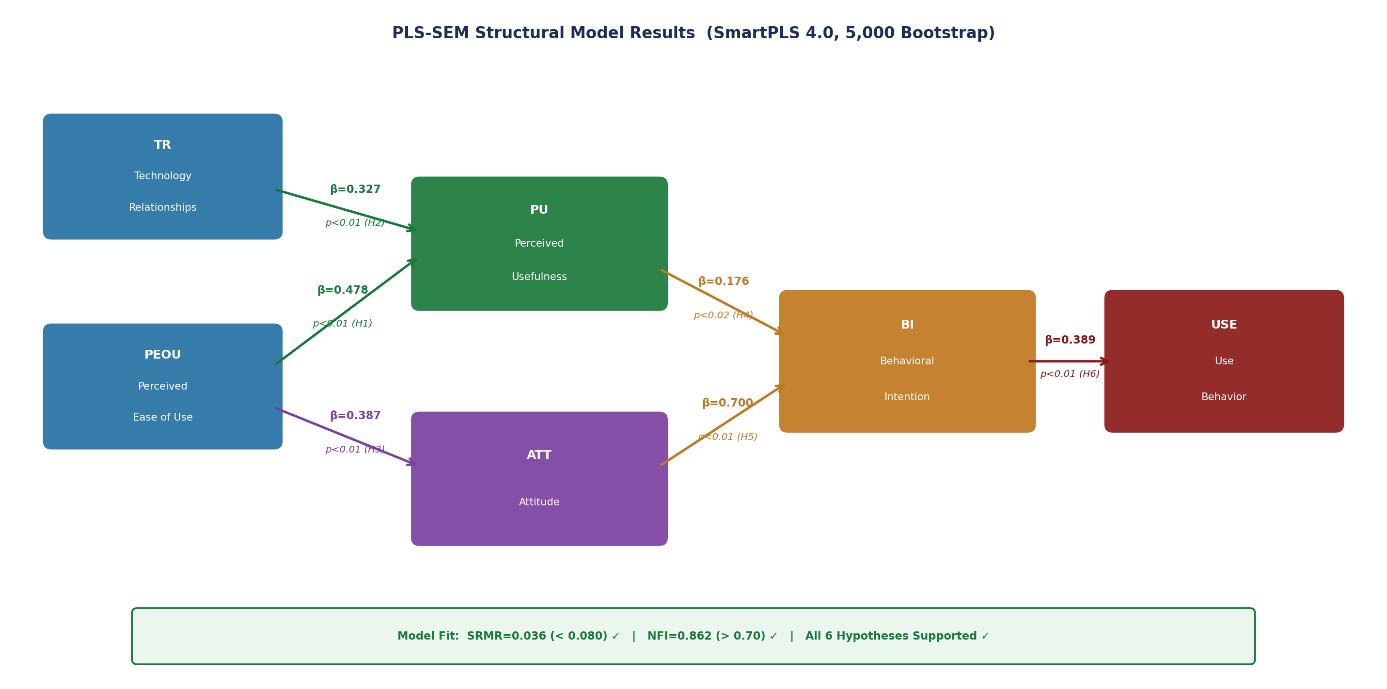
Figure 4. PLS-SEM Structural Model - Path Coefficients, R² and Model
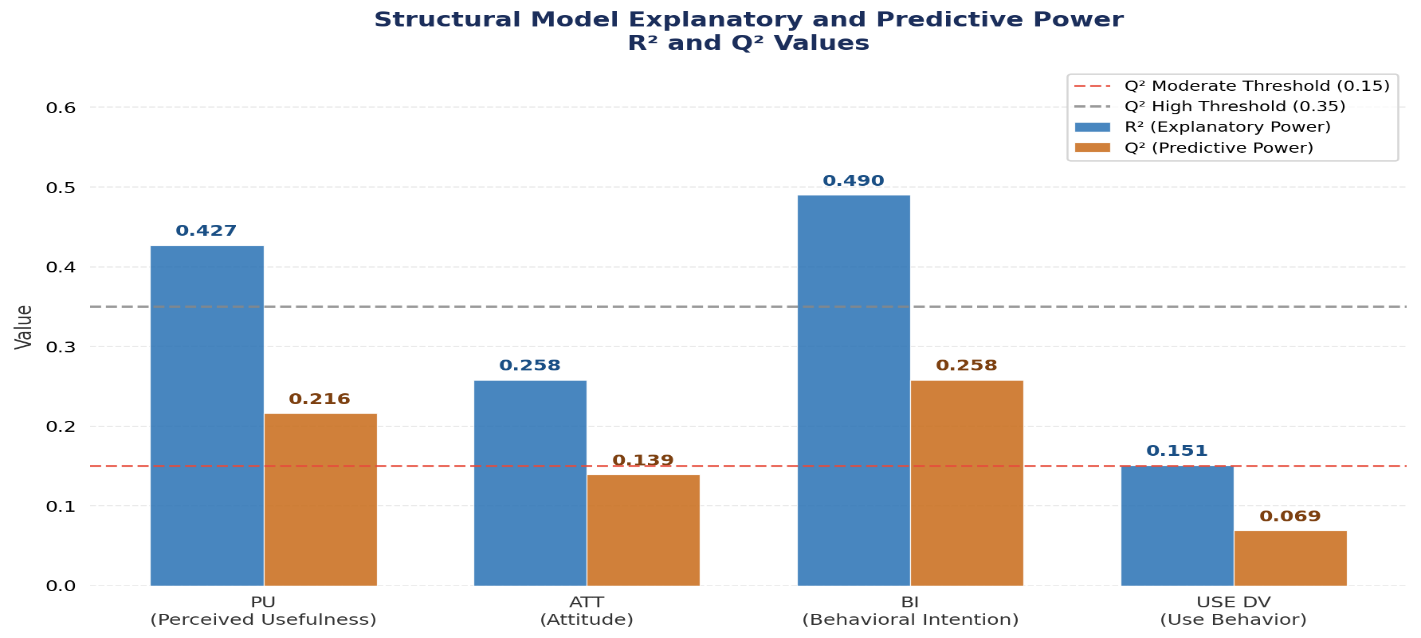
Figure 5. R² Explanatory Power and Q² Predictive Power Values
| Internal Variable | R² | R² Level | Q2 | Q2 Level |
| PU (Perceived Usefulness) | 0.427 | Medium | 0.216 | Medium |
| ATT (Attitude) | 0.258 | Weak-Moderate | 0.139 | Low |
| BI (Intention to Use) | 0.490 | Strong | 0.258 | Medium |
| USE (Usage Behaviour) | 0.151 | Weak | 0.069 | Low |
Table 7. Explanatory and Predictive Power of the Structural Model (R² and Q²)
Note: Q2 interpretation: 0.02–0.15 Low | 0.15–0.35 Moderate | >0.35 High (Shmueli et al., 2016).
| H | Path | Beta | Std. Dev. | t-Value | p | 95% CI | F² / Result |
| h2 | PEOU → PU | 0.478 | 0.049 | 9.760** | <0.01 | [0.384-0.573] | 0.365 High |
| H2 | TR → PU | 0.327 | 0.049 | 6.723** | <0.01 | [0.232-0.422] | 0.171 Medium |
| H3 | PEOU → ATT | 0.387 | 0.062 | 6.238** | <0.01 | [0.266-0.507] | 0.136 Medium |
| H4 | PU → ATT | 0.176 | 0.067 | 2.623** | <0.01 | [0.042-0.303] | 0.028 Low |
| H5 | ATT → BI | 0.700 | 0.032 | 21.691** | <0.01 | [0.636-0.762] | 0.962 Very High |
| H6 | BI → USE | 0.389 | 0.054 | 7.260** | <0.01 | [0.283-0.495] | 0.178 Medium |
Table 8. PLS-SEM Hypothesis Test Results (5,000 Bootstrap
Note: **p<0.01. f2: 0.02=Small, 0.15=Moderate, 0.35=Large (Cohen, 1988). SRMR=0.036 (<0.080), NFI=0.862 (>0.70). All six hypotheses were supported.
The PLS-SEM analysis indicated that all six hypotheses were supported at the p<0.01 significance level. The most robust path in the model was ATT → BI (β=0.700, f²=0.962), signifying that attitude is the most influential predictor of behavioral intention. The path PEOU → PU (β=0.478, f²=0.365) exhibited a substantial effect size, affirming that ease of use significantly enhances perceived usefulness. TR → PU (β=0.327, f²=0.171) demonstrated a medium effect, suggesting that healthcare workers' general relationship with technology positively influences their perception of usefulness. The weakest path was PU → ATT (β=0.176, f²=0.028), reflecting a low yet statistically significant effect. BI → USE (β=0.389, f²=0.178) confirmed that behavioral intention translates into actual usage behavior at a medium effect level. Overall, the model demonstrated acceptable fit (SRMR=0.036, NFI=0.862), supporting the theoretical validity of the extended TAM/UTAUT framework in the Azerbaijani healthcare context.
Findings from Stage 2: Latent Class Analysis
Model Selection - Table 9 presents the fit statistics for the two-, three-, and four-class LCA models. The Bayesian Information Criterion (BIC) is considered a stricter criterion than the AIC in terms of both accuracy and penalty for model complexity and was therefore used as the primary criterion for model selection. While the BIC decreased by 321 points when moving from two to three classes (a significant improvement), it decreased by only 117 points when moving from three to four classes (a small incremental gain). Consequently, a three-class model was selected.
| Model | Log-L | AIC | BIC | Decision |
| 2-Class Model | -5024.13 | 10104.25 | 10216.16 | - |
| 3-Class Model | -4833.60 | 9743.19 | 9895.06 | SELECTED |
| 4-Class Model | -4745.21 | 9586.42 | 9778.25 | Complex/Low Contribution |
Table 9. LCA Model Comparison Criteria
Note: For the transition from class 2 to class 3, ΔBIC = 321.1 (a significant improvement). For the transition from class 3 to class 4, ΔBIC = 116.8 (minor improvement) was obtained. A three-class model was selected.
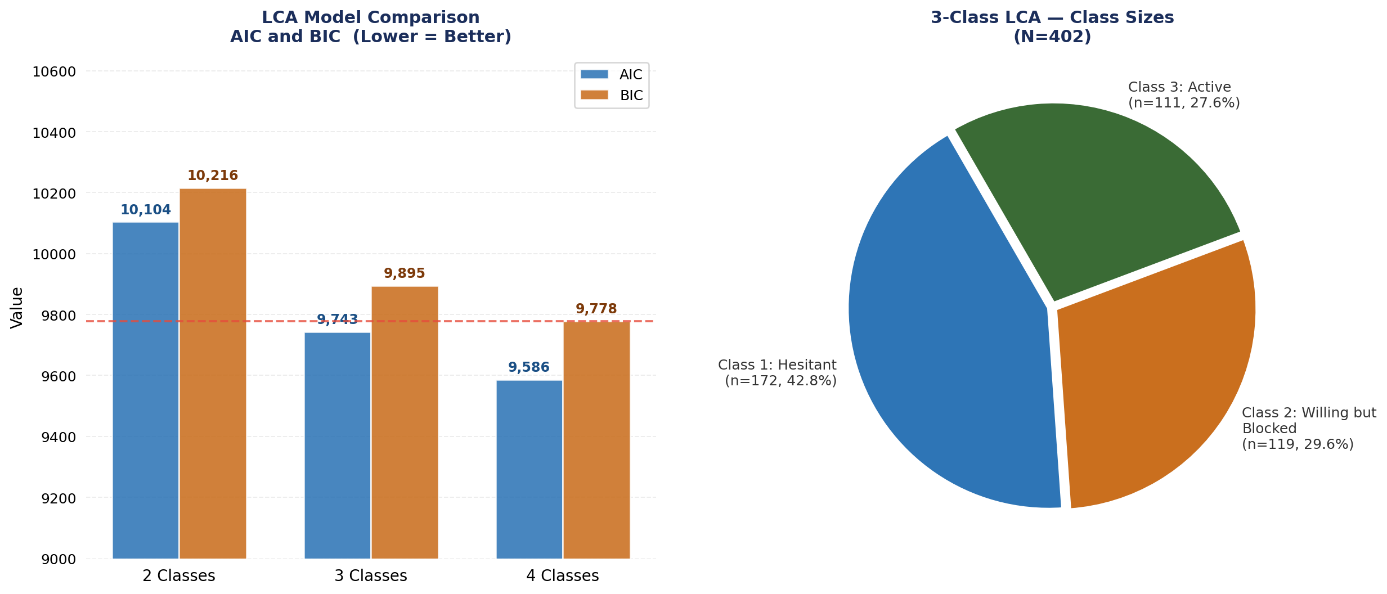
Figure 6. LCA Model Comparison (AIC/BIC) and Class Sizes
Class Profiles
Figure 7 displays the structural means for the three LCA classes in the study. The class profiles clearly reveal the unique structure of each group’s adoption of Industry 4.0 technologies.
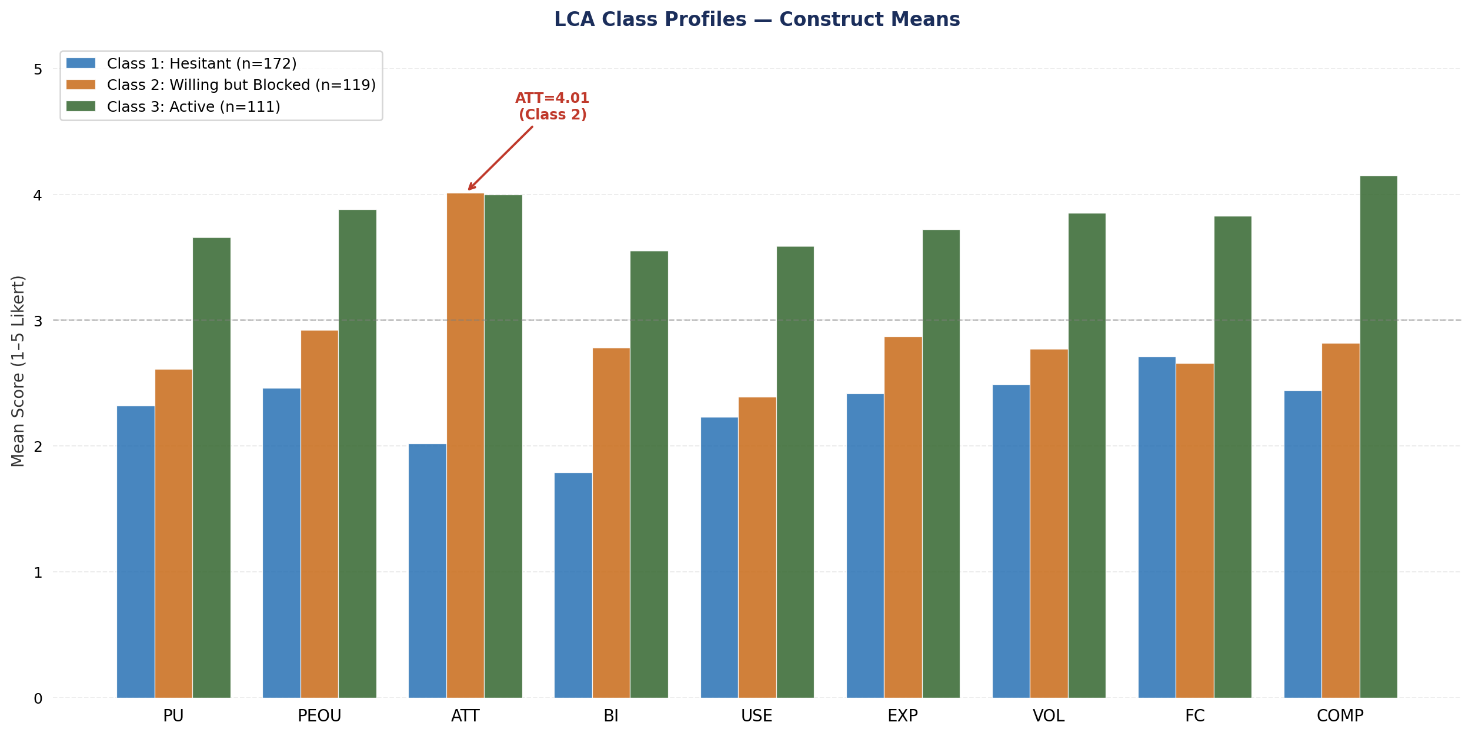
Figure 7. LCA Class Profiles - Structural Averages
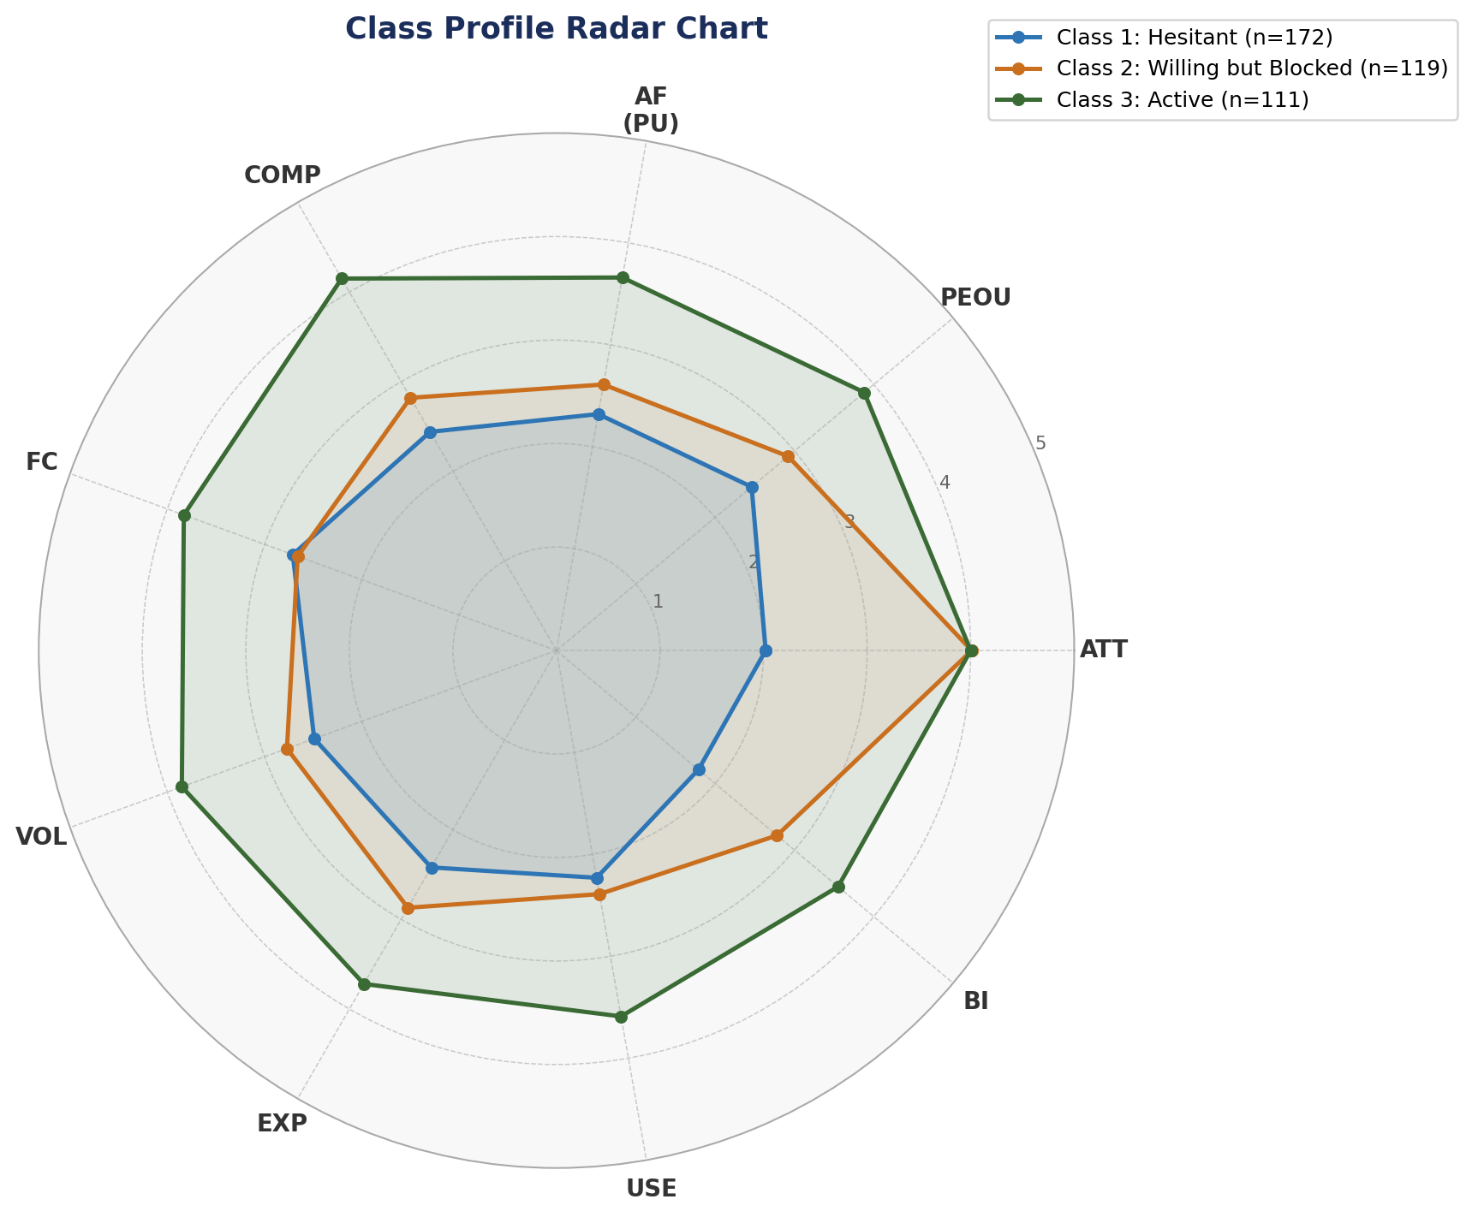
Figure 8. Class Profile Radar Chart
| Structure | PU | PEOU | ATTITUDE | BI | USE | DYNK |
| Class 1: Reluctant Users (n=172) | 2.32 | 2.46 | 2.02 | 1.79 | 2.23 | 2.71 |
| Class 2: Willing but Unable Users (n=119) | 2.61 | 2.92 | 4.01 | 2.78 | 2.39 | 2.66 |
| Class 3: Active Users (n=111) | 3.66 | 3.88 | 4.00 | 3.55 | 3.59 | 3.83 |
Table 10. LCA Class Profiles - Selected Construct Means
Note: In Class 2, while ATTITUDE=4.01 is the highest value, BEHAVIOUR=2.39 remains low. This paradox reflects the attitude-behaviour gap. DYNK (Support) has the lowest value (2.66) of all classes in Class 2.
The class profiles delineated in Table 10 identify three psychologically distinct cohorts. Reluctant Users (Class 1, n=172) consistently exhibited low scores across all constructs, notably in Attitude (2.02) and Behavioural Intention (1.79), indicating a general resistance to technology adoption. Willing but Unable Users (Class 2, n=119) presented a notable paradox: despite achieving the highest Attitude score (4.01) among all classes, their Usage Behaviour remained low (USE=2.39). This discrepancy between attitude and actual behaviour suggests that organizational barriers, rather than motivational factors, hinder technology adoption within this group. The lowest DYNK score (2.66) among all classes further supports this interpretation, indicating insufficient facilitating conditions. Active Users (Class 3, n=111) displayed uniformly high scores across all constructs, with the highest values recorded for PU (3.66), PEOU (3.88), Attitude (4.00), Intention (3.55), and Usage Behaviour (3.59), reflecting a fully integrated technology adoption pattern supported by adequate organizational infrastructure (DYNK=3.83).
Demographic Predictors
Table 11 delineates the outcomes of the chi-square analyses investigating the association between class membership and demographic variables. Among the six demographic variables assessed, only sex showed a statistically significant association. Specifically, gender emerged as the sole demographic variable that significantly predicted class membership (χ²=11.71, p=0.003). Female healthcare workers are disproportionately represented in the ‘Willing but Unable’ class, comprising 71.4 percent. In contrast, occupational group, type of institution, age, and experience were not significant predictors, indicating that the differentiation in profiles is attributable to psychosocial rather than demographic mechanisms.
| Demographic Variable | Chi-Square (χ²) | df | p-value | Result |
| Occupational Group | 6.594 | 4 | 0.159 | Not significant |
| Organisation Type | 8,187 | 12 | 0.770 | Not significant |
| Professional Experience | 4,282 | 6 | 0.639 | Not significant |
| Age Group | 5.931 | 6 | 0.431 | Not significant |
| Gender | 11,713 | 2 | 0.003*** | SIGNIFICANT |
| Educational Attainment | 4.366 | 6 | 0.627 | Not significant |
Table 11. Class Membership and Demographic Variables - Chi-Square Results
Note: *** p<0.001, ** p<0.01, * p<0.05. The only variable that significantly predicted class membership was gender.
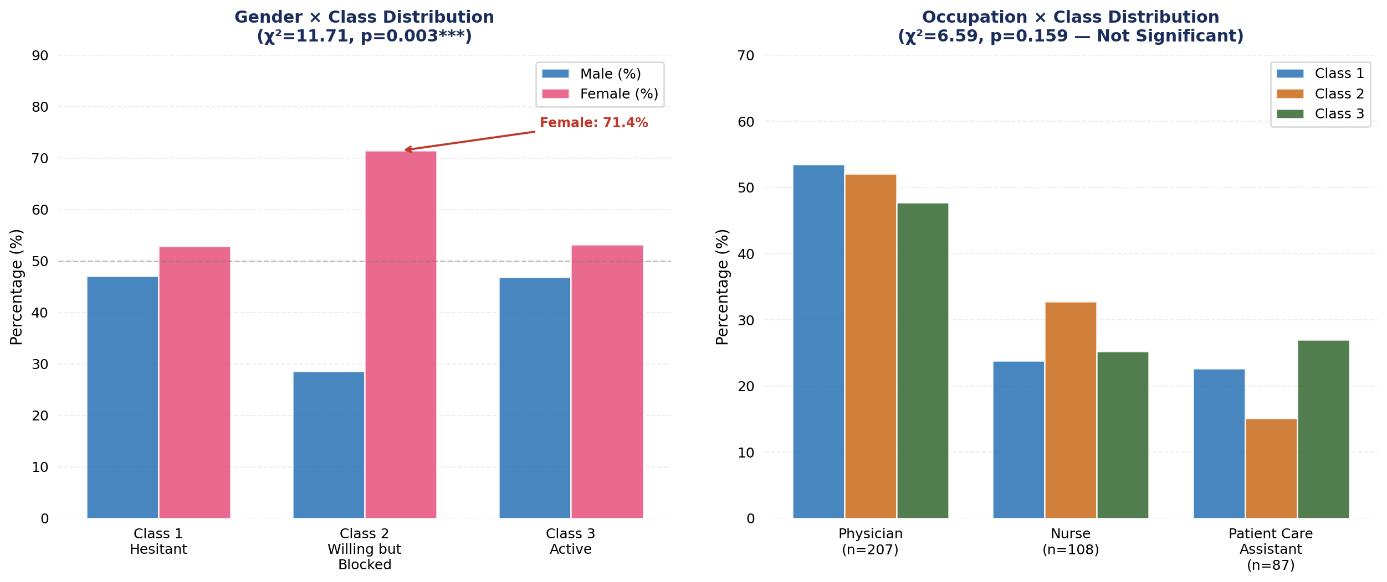
Figure 9. Gender and Occupational Group Distribution Across LCA Classes
Findings from Stage 3: Multi-Group SEM
Invariance Test -Table 11 presents a comparative analysis of the configurational and metric models. The scaled chi-square difference test (Satorra & Bentler, 2001) revealed that constraining the structural regression paths to be equal across classes significantly worsened model fit (Δχ²=31.65, df=16, p=0.011). This indicates that structural path invariance was not supported across the three LCA classes — that is, the regression paths from the constructs to Usage Behaviour (USE) differ significantly across groups. It should be noted that this test specifically concerns the equality of structural (regression) coefficients across classes, not the equality of factor loadings.
| Model | sd | AIC | BIC | χ² | Δχ² | p |
| Configurational Model | 0 | 971.21 | 1091.10 | 0.000 | - | - |
| Metric Model | 16 | 970.47 | 1026.41 | 31,267 | 31.646 | 0.011* |
Table 12. Measurement Invariance Test Results
Note: * p<0.05. "Structural path invariance was rejected; regression coefficients from constructs to USE differ significantly across LCA classes
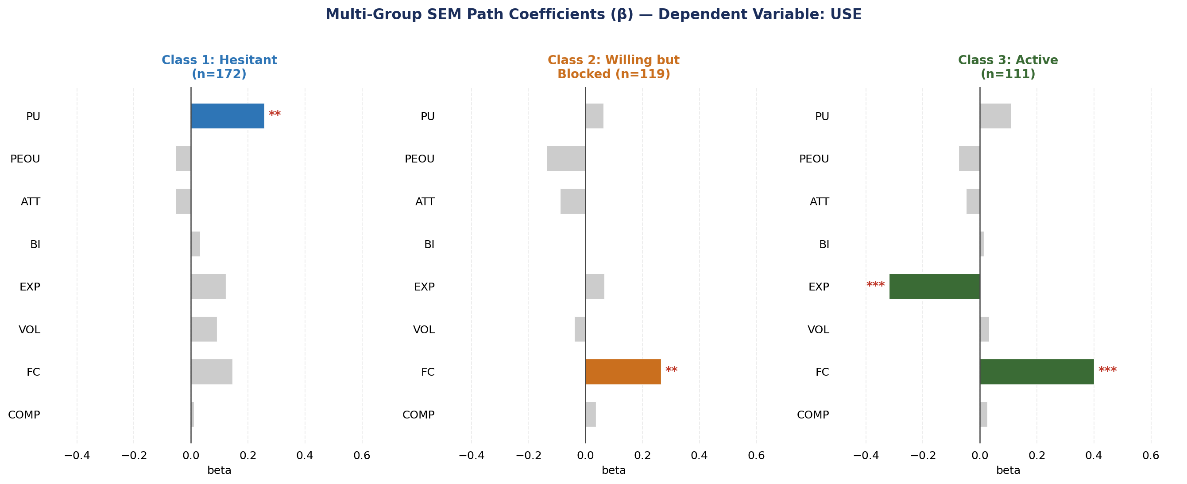
Figure 10. MGSEM Path Coefficients - β Values for Each LCA Class (Dependent: USE)
| Variable | Class 1 β | Class 1 p | Class 2 β | Class 2 p | Class 3 β | Class 3 p |
| PU | 0.258 | 0.001** | 0.063 | 0.477 | 0.110 | 0.289 |
| PEOU | -0.054 | 0.532 | -0.137 | 0.162 | -0.075 | 0.374 |
| ATT | -0.055 | 0.380 | -0.089 | 0.242 | -0.048 | 0.573 |
| BI | 0.032 | 0.684 | 0.003 | 0.976 | 0.014 | 0.855 |
| DNYM | 0.122 | 0.221 | 0.06 | 0.491 | -0.318 | 0.000*** |
| GNLK | 0.091 | 0.371 | -0.03 | 0.688 | 0.032 | 0.741 |
| DYNK | 0.146 | 0.172 | 0.265 | 0.009** | 0.400 | 0.000*** |
| UYUM | 0.010 | 0.917 | 0.037 | 0.674 | 0.026 | 0.749 |
| R² | 0.148 | 0.112 | 0.268 |
Table 13. MGSEM Class-Based Path Coefficients - Dependent Variable: USE
Note: *** DYNK (Facilitating Conditions) was a significant predictor for Class 2 (β=0.265, p=0.009) and Class 3 (β=0.400, p<0.001). In Class 1, PU (Perceived Usefulness) was the only significant predictor (β=0.258, p=0.001).
The results of the MGSEM analysis, as depicted in Table 13, indicate significant variations in the structural paths leading to Usage Behaviour (USE) across the three LCA classes, thereby supporting the rejection of full structural path invariance (Δχ²=31.65, df=16, p=0.011). For Reluctant Users (Class 1), Perceived Usefulness (PU) was identified as the sole significant predictor of usage behaviour (β=0.258, p=0.001), implying that this cohort necessitates substantial evidence of tangible benefits prior to technology adoption. In the case of Willing but Unable Users (Class 2), DYNK (Facilitating Conditions) emerged as the only significant predictor (β=0.265, p=0.009), indicating that organizational support and infrastructure constitute the primary obstacles preventing this group from converting their positive attitudes into actual usage. For Active Users (Class 3), two significant predictors were discerned: DYNK (β=0.400, p<0.001) as a positive predictor and Experience (DNYM, β=-0.318, p<0.001) as a negative predictor, suggesting that more experienced individuals within this group may develop alternative usage patterns that diminish their reliance on formal facilitating conditions. Notably, DYNK emerged as the dominant predictor for Classes 2 and 3, while PU was the defining predictor for Class 1, suggesting that different barriers operate across user profiles.
Findings from Stage 4: Artificial Neural Network (ANN)
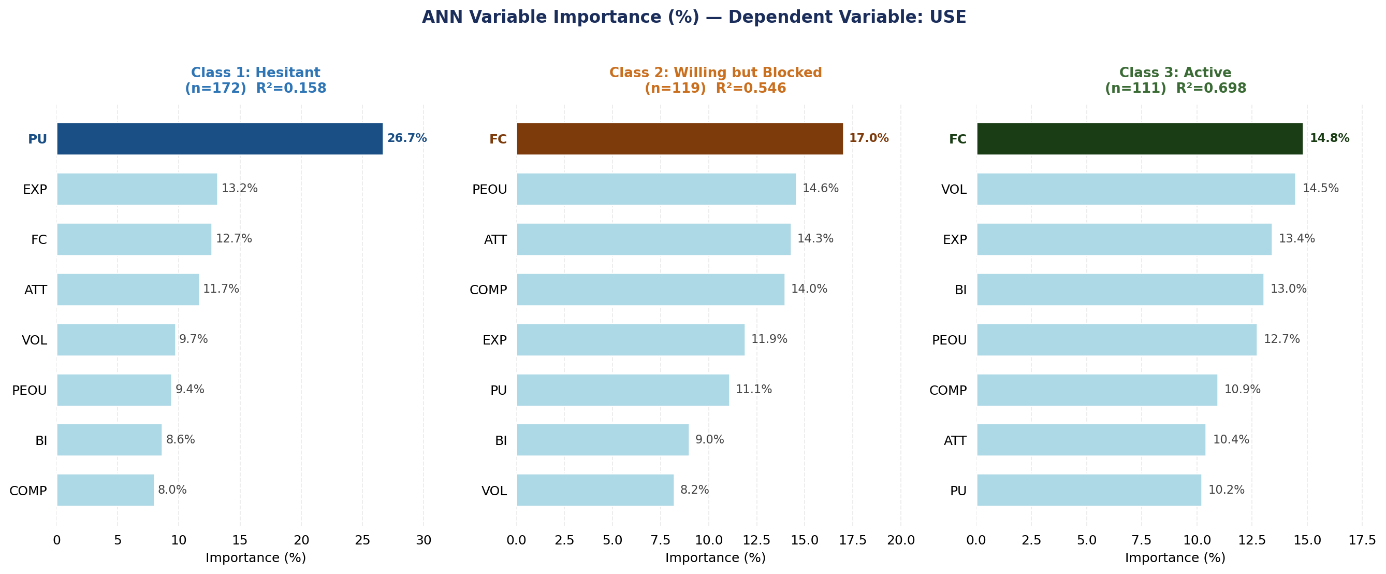
Figure 11. ANN Variable Importance (%) - Garson Method, Average of 50 Seeds
| Rank | Class 1 Variable | Class 1 % | Class 2 Variable | Class 2 % | Class 3 Variable + % |
| 1 | PU | 26.7% | DYNK | 17.0% | DYNK - 14.8% |
| 2 | DNYM | 13.2 | AKK | 14.6% | GNLK - 14.5% |
| 3 | DYNK | 12.7% | ATT | 14.3 | DNYM -13.4% |
| R² | 0.158 | 0.546 | 0.698 |
Table 14. ANN Variable Importance - Top 3 Variables by Class
The results of the ANN analysis, as depicted in Table 14, align closely with the findings from the MGSEM, thereby enhancing the robustness of the study's conclusions. For Reluctant Users (Class 1), Perceived Usefulness (PU) emerged as the most significant variable (26.7%), followed by Experience (DNYM, 13.2%) and DYNK (12.7%), with a moderate explanatory power of R²=0.158. In the case of Willing but Unable Users (Class 2), DYNK was identified as the most critical variable (17.0%), followed by Perceived Ease of Use (PEOU, 14.6%) and Attitude (ATT, 14.3%), with a substantially higher explanatory power of R²=0.546, indicating that facilitating conditions are particularly decisive for this group. For Active Users (Class 3), DYNK again ranked first (14.8%), followed by Voluntariness (GNLK, 14.5%) and Experience (DNYM, 13.4%), with the highest explanatory power across all classes (R²=0.698), reflecting the complexity and richness of adoption behavior in this group. The convergence of both linear (MGSEM) and non-linear (ANN) methods around DYNK as the most critical variable across all classes provides strong methodological triangulation and confirms the central importance of organizational facilitating conditions in healthcare technology adoption.
SEM and ANN Consistency Analysis
Figure 12 compares the SEM and ANN R² values for the three classes, and Table 15 summarises the predictive consistency between the two methods.
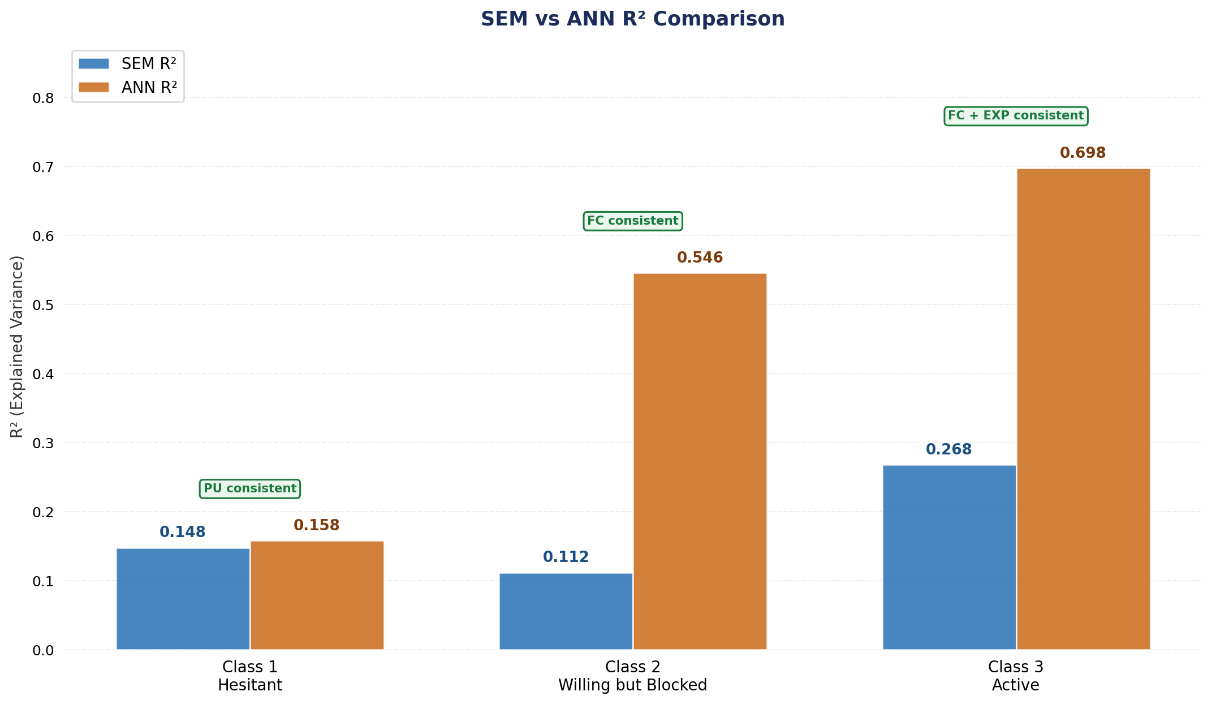
Figure 12. SEM vs ANN R² Comparison and Inter-method Consistency
| Class | SEM Significant Path | ANN Most Important | Consistency |
| Class 1: Reluctant Users | PU (β=0.258***) | PU (26.7%) | CONSISTENT -Both methods indicate AF |
| Class 2: Willing but Unable | DYNK (β=0.265**) | DYNK (17.0%) | CONSISTENT - Both methods indicate DYNK |
| Class 3: Active | DYNK (β=0.400***) DNYM (β=-0.318***) | DYNK (14.8%) | CONSISTENT - DYNK is critical in both |
Table 15. SEM-ANN Methodological Triangulation Comparison
The two methods are broadly supportive of one another, with both identifying DYNK as the primary predictor for Classes 2 and 3, and PU for Class 1. However, the consistency is not complete: in Class 2, ANN also ranks PEOU and ATT among important variables, whereas MGSEM identifies only DYNK as statistically significant. In Class 3, ANN highlights GNLK as the second-ranked variable, while MGSEM does not identify it as a significant path. These partial discrepancies reflect the difference between statistical significance (MGSEM) and predictive importance (ANN), and do not undermine the overall convergence of the findings.
5. DISCUSSION AND CONCLUSION
Interpretation of Finding
The primary contribution of this study lies in its empirical demonstration that healthcare workers' acceptance behaviours towards Industry 4.0 technologies are not uniformly distributed. The three classes identified through Latent Class Analysis (LCA) represent distinct psychosocial profiles, independent of demographic characteristics. The observation that occupational group, organisation type, age, or experience do not determine class membership suggests that managers should formulate their technology adoption strategies based on psychographic profiles rather than demographic factors.
The most notable finding of this study from a theoretical standpoint is the identification of the 'Willing but Unable' profile. The 119 participants in this category exhibited relatively high scores in ATTITUDE (%4.01) and DYNK (Facilitating Conditions) (mean=2.66), yet demonstrated low scores in Usage Behaviour (USE=2.39) and support (DYNK=2.66). This paradoxical structure is consistent with Ajzen’s (1991) concept of the intention-behaviour gap, which illustrates that a positive attitude does not necessarily lead to actual usage and that organizational support and facilitating conditions are crucial. The fact that both the MGSEM and ANN findings identified DYNK as the most critical predictor of this class strongly corroborates this interpretation.
The gender-based findings are of considerable significance in this study. The disproportionate representation of female healthcare workers in the 'Willing but Unable' category (71.4%) indicates gender-specific organizational barriers to participating in training. This situation can be evaluated in relation to the study by Venkatesh and Morris (2000), who examined gender differences in technology adoption. The fact that female healthcare workers, despite their willingness to adopt technology, may face potential disadvantages in terms of institutional support, access opportunities, and training facilities, suggests a possible concern regarding organizational equity. This study makes significant contributions at three levels:
Theoretical Contribution: By employing Latent Class Analysis within a TAM/UTAUT framework, this research empirically illustrates the presence of intra-group heterogeneity among healthcare workers. This finding challenges the homogeneity assumption prevalent in standard SEM-based technology acceptance studies and advocates for profile-based theoretical extensions.
Methodological Contribution: This investigation is the first in health technology acceptance research to concurrently integrate PLS-SEM, LCA, MGSEM, and ANN. The broad convergence of linear (SEM) and non-linear (ANN) methods around the same primary predictors enhances the robustness of the findings, while the partial discrepancies offer additional insight into the difference between statistical significance and variable importance.
Practical Contribution: The identification of three distinct profiles offers direct intervention points for healthcare managers. Reluctant Users require communication focused on benefits; Willing but Unable Users necessitate improved organizational infrastructure and gender-sensitive access policies; Active Users benefit from advanced training and mentoring roles.
Summary of Key Findings
This study presents four principal findings. Firstly, healthcare workers do not constitute a homogeneous group; rather, three distinct technology acceptance profiles exist independently of demographic characteristics. Secondly, the profile of Willing but Unable Users clearly exemplifies the attitude-behavior gap, wherein positive attitudes do not translate into actual usage due to inadequate organizational support. Thirdly, gender emerges as the sole significant demographic predictor of class membership, with female staff disproportionately represented in the Willing but Unable Users category, indicating potential structural barriers. Lastly, Facilitating Conditions (DYNK) are the most critical predictor for Classes 2 and 3, whereas Perceived Usefulness (PU) is the primary predictor for Class 1, indicating that the barriers to adoption differ meaningfully by user profile, highlighting the central role of organizational infrastructure in technology adoption.
| Target Group | Proposed Strategy | Expected Impact |
| Reluctant Users (n=172) | Concrete evidence of benefits and success stories should be shared; peer learning programmes should be implemented | Increased perceived benefit - strengthened intention |
| Willing but Unable Users (n=119) | Improvements to organisational infrastructure, helpdesks, and gender-sensitive access policies should be established | Closing the attitude-behaviour gap |
| Active Users (n=111) | Advanced training, mentoring roles and technology champion programmes should be implemented | Accelerating organisational adoption |
Table 16. Recommendations for Healthcare-Based Implementation
Limitations and Future Research This study acknowledges several limitations. Firstly, the cross-sectional design limits the ability to establish definitive causal relationships between variables. Future research should employ longitudinal LCA designs to monitor class transitions over time and establish causality more rigorously. Secondly, data collection was confined to Azerbaijan. Cross-cultural comparative studies involving healthcare workers from different national contexts are necessary to assess the generalizability of the findings. Thirdly, although both MGSEM and ANN identified DYNK (Facilitating Conditions) as a critical variable, the specific dimensions of this construct remain underexplored. Qualitative studies examining the relationship between facilitating conditions and organizational culture, budget allocation, and leadership support could provide greater depth to these findings. Fourthly, future research should integrate actual technology usage data-such as system log records and objective usage metrics-with self-reported survey data to more reliably measure the intention-behavior gap identified in this study.
References
- Ajzen, I. (1991). The theory of planned behavior. Organizational Behavior and Human Decision Processes, 50(2), 179–211. https://doi.org/10.1016/0749-5978(91)90020-T
- Cohen, J. (1988). Statistical power analysis for the behavioral sciences (2nd ed.). Lawrence Erlbaum Associates.
- Collins, L. M., & Lanza, S. T. (2010). Latent class and latent transition analysis: With applications in the social, behavioral, and health sciences. John Wiley & Sons.
- Colmenar-Santos, A., Rosales-Asensio, E., Collado-Fernández, D., & Mur-Pérez, F. (2023). Impact of Industry 4.0 on healthcare: A systematic review on the impact of healthcare workers' technology acceptance. Frontiers in Public Health, 11, 1143662. https://doi.org/10.3389/fpubh.2023.1143662
- Davis, F. D. (1989). Perceived usefulness, perceived ease of use, and user acceptance of information technology. MIS Quarterly, 13(3), 319–340. https://doi.org/10.2307/249008
- Fornell, C., & Larcker, D. F. (1981). Evaluating structural equation models with unobservable variables and measurement error. Journal of Marketing Research, 18(1), 39–50. https://doi.org/10.1177/002224378101800104
- Hair, J. F., Risher, J. J., Sarstedt, M., & Ringle, C. M. (2021). When to use and how to report results of PLS-SEM. European Business Review, 31(1), 2–24. https://doi.org/10.1108/EBR-11-2018-0203
- Henseler, J., Ringle, C. M., & Sarstedt, M. (2015). A new criterion for assessing discriminant validity in variance-based structural equation modeling. Journal of the Academy of Marketing Science, 43(1), 115–135. https://doi.org/10.1007/s11747-014-0403-8
- Jat, A. S., Grønli, T. M., & Ghinea, G. (2024). Technological utilization in remote healthcare: Factors influencing healthcare professionals' adoption and use of remote patient monitoring. Journal of Medical Internet Research, 26, e47694. https://doi.org/10.2196/47694
- Jiang, H., Cheng, Y., Yang, J., & Gao, S. (2022). AI-driven COVID-19 decision making and prediction using hybrid prediction approaches: A systematic review. Healthcare, 10(5), 899. https://doi.org/10.3390/healthcare10050899
- Kim, M., Kim, S., & Park, J. (2025). Latent profiles and predictors of transfer-assistive robot acceptance among Korean care workers. Geriatric Nursing, 61, 12–20. https://doi.org/10.1016/j.gerinurse.2024.09.012
- Lee, A. T., Ramasamy, R. K., & Subbarao, A. (2025). Understanding psychosocial barriers to healthcare technology adoption: A review of TAM and UTAUT frameworks. Healthcare, 13(3), 250. https://doi.org/10.3390/healthcare13030250
- Moore, G. C., & Benbasat, I. (1991). Development of an instrument to measure the perceptions of adopting an information technology innovation. Information Systems Research, 2(3), 192–222. https://doi.org/10.1287/isre.2.3.192
- Rosseel, Y. (2012). lavaan: An R package for structural equation modeling. Journal of Statistical Software, 48(2), 1–36. https://doi.org/10.18637/jss.v048.i02
- R Core Team. (2024). R: A language and environment for statistical computing. R Foundation for Statistical Computing. https://www.R-project.org/
- Satorra, A., & Bentler, P. M. (2001). A scaled difference chi-square test statistic for moment structure analysis. Psychometrika, 66(4), 507–514. https://doi.org/10.1007/BF02296192
- Shmueli, G., Ray, S., Velasquez Estrada, J. M., & Chatla, S. B. (2016). The elephant in the room: Predictive performance of PLS models. Journal of Business Research, 69(10), 4552–4564. https://doi.org/10.1016/j.jbusres.2016.03.049
- Staeck, R., Stuble, M., & Drüge, M. (2024). Exploring subgroups of acceptance prediction for e-mental health among psychotherapists-in-training: A latent class analysis. Frontiers in Psychiatry, 15, 1296449. https://doi.org/10.3389/fpsyt.2024.1296449
- StataCorp. (2024). Stata statistical software: Release 19. StataCorp LLC.
- Thanthrige, A., Lu, B., Sako, Z., & Wickramasinghe, N. (2025). Determinants of health care technology adoption using an integrated UTAUT and TTF model: Systematic review and meta-analysis. Journal of Medical Internet Research, 27, e64524. https://doi.org/10.2196/64524
- Venkatesh, V., & Davis, F. D. (2000). A theoretical extension of the technology acceptance model: Four longitudinal field studies. Management Science, 46(2), 186–204. https://doi.org/10.1287/mnsc.46.2.186.11926
- Venkatesh, V., & Morris, M. G. (2000). Why don't men ever stop to ask for directions? Gender, social influence, and their role in technology acceptance and usage behavior. MIS Quarterly, 24(1), 115–139. https://doi.org/10.2307/3250981
- Venkatesh, V., Morris, M. G., Davis, G. B., & Davis, F. D. (2003). User acceptance of information technology: Toward a unified view. MIS Quarterly, 27(3), 425–478. https://doi.org/10.2307/30036540
- Venkatesh, V., Thong, J. Y. L., & Xu, X. (2012). Consumer acceptance and use of information technology: Extending the unified theory of acceptance and use of technology. MIS Quarterly, 36(1), 157–178. https://doi.org/10.2307/41410412
- Wu, S., Zheng, Y., Wang, L., & Liu, W. (2024). Differences in influencing mechanism of clinicians' adoption behavior for liver cancer screening technology between the leading and subordinate hospitals within medical consortiums. BMC Cancer, 24, 534. https://doi.org/10.1186/s12885-024-12272-3Author 1, A.B. Title of Thesis. Level of Thesis, Degree-Granting University, Location of University, Date of Completion.


