International Journal of Management Science and Business Administration
Volume 7, Issue 4, May 2021, Pages 45-59
Impact of Public Sector Financial Management on the Economic Growth of Nigeria
DOI: 10.18775/ijmsba.1849-5664-5419.2014.74.1006
URL: https://doi.org/10.18775/ijmsba.1849-5664-5419.2014.74.1006
1 Kanu Success Ikechi,2 Obi Henry Kenedunium,3 Akuwudike Hilary Chinedum
1 Department of Banking and Finance, Faculty of Social and Management Sciences, Eastern Palm University, Ogboko Ideato,P.M.B 6, Orlu Imo State. Nigeria
2 Department of Accounting, Nnamdi Azikiwe University Awka, Anambra state, Nigeria
3 Department of Business Administration , Faculty of Social and Management Sciences, Eastern Palm University, Ogboko Ideato ,P.M.B 6, Orlu Imo State. Nigeria
Abstract: The main thrust of this study is to investigate the seeming mismatch between resource generation, resource allocation and expenditure management in Nigeria. While an ex-post facto research design was adopted in the investigation; descriptive statistics as well as a least square regression analysis were carried out on a time-series data to ascertain relationships. Real Gross Domestic Product taken as a proxy for economic growth is the dependent variable while capital and recurrent expenditures are the independent variables. Outcome of the study indicates that, the nation’s financing option is skewed towards payment of salaries and personnel emoluments (Recurrent Expenditures) as against the provision of basic infrastructures (Capital Expenditures) that are growth oriented. The trend of disbursements is not appropriately harnessed to create a favorable and positive impact on economic growth. In the short run, the disaggregated components of capital expenditure (CAPEX) indicate that expenses incurred in administration sector and external debt service transfers attracted more than their fare share of public expenditure to the detriment of economic and social community welfare services. The disaggregated component of recurrent expenditures (RECEX) indicate that expense on economic service sector and the lagged value of RGDP taken as an explanatory variable were found to have a positive significant relationship with economic growth in the long run. It is therefore recommended that conscious efforts be made by government to scrutinize and monitor budget implementations. Macroeconomic projections should guide the overall level of expenditures. This should be more realistic, internally consistent and based on more accurate and timely information. Government must embark on a careful estimation and determination of priorities and to emphasize the need for control over revenue and expenditure so as to enhance critical areas of economic growth in Nigeria.
Keywords: Real gross domestic product, Total revenue, Total expenditure, Administrative, economic, social and community service expenses, Transfers, Public sector financial management.
Impact of Public Sector Financial Management on the Economic Growth of Nigeria
1. Background of the study
Public sector financial management is hinged on pursuing policies that are geared towards the attainment of overall economic development of a nation. It addresses core objectives that include but not limited to economic and governance reform projects of government, utilizing principles of monetary discipline, legitimacy, predictability, transparency and accountability to reform and strengthen public finances. Well-designed and effectively implemented financial policies hold a great deal of promise. They help to contain helpless service delivery, enhancement of equity, minimization of debasement, reduction in deficit inclination, and time inconsistency of budgetary policies. It also helps to, strengthen the credibility of government's commitment to financial manageability and along these lines facilitate countercyclical monetary management. By increasing the predictability of financial arrangement, monetary rules can likewise lower yield instability and lift long haul development ( Jinghan 1990).
Omelehinwa(2014) points that public sector financial management has to do with activities that are involved in resource generation, resource allotment and expenditure management in government to achieve efficient and effective delivery of public labor and products.
Given that the resources for attainment of economic development are relatively scarce, concerted efforts are usually made to ascertain areas of greatest needs where resources could be channeled to, so as to have the greatest satisfaction. This goes to emphasize the need for allocation of scarce resources among alternative uses. It is necessary to ascertain if a country’s resources are fully utilized or not. It is also expedient to find out what commodities are being produced and in what quantities. After this, the mode of production amongst others are considered and chosen. How efficient the production processes are, also constitute a source of concern to government as this to some extent determine how the products could equitably be distributed. This also brings to the fore, the need to ascertain if an economy is producing at its optimum capacity or not. (Lipsy; 1982).
Under normal circumstances, because of its efficiency, the private sector, through market mechanism is the obvious choice of carrying out the above functions. However, even in the most democratic of all nations, substantial public sectors still exist. The reasons for this are historic, social and economic. (Anuya, 2010).
From the foregoing analysis; it could be said that, public sector financial management has crucial roles to play in harnessing the economic growth of any nation. It is expected to bring about desirable consequences to an economy at large.
1.2 Problem Statement
Nigerians have witnessed economic and social reform programs intended to launch the nation on the path of meaningful economic growth and development. The nation has equally witnessed a tremendous increase in her revenue profile especially the accruals from oil exports and non oil revenue which consists essentially of tax related funds. These are depicted in table 1 below:
Table 1: Total Federally Collected Revenue – (2015-2019)
| Year | 2015 | 2016 | 2017 | 2018 |
| Total Federally Collected Revenue (N’ Billions) | 6,912.50 | 5,616.40 | 7,445.00 | 9,551.80 |
| Oil Revenue (N’ Billions) | 3,830.10 | 2,693.90 | 4,109.80 | 5,545.80 |
| Non- Oil Revenue (N’ Billions) |
3,082.41 | 2,922.50 | 3,335.20 | 4,006.00 |
Source: CBN statistical bulletin 2019
Ironically, there has been an increase too, in government’s expenditure pattern overtime as depicted in table 2 below:
Table 2: Total Expenditure profile – (2015-2019)
| Year | 2015 | 2016 | 2017 | 2018 |
| Total Expenditure | 4,988.86 | 5,858.56 | 6,456.70 | 7,813.74 |
| Recurrent Expenditure | 3,831.95 | 4,160.11 | 4,779.99 | 5,675.19 |
| Capital Expenditure | 818.37 | 653.61 | 1,242.30 | 1,682.10 |
Source: CBN statistical bulletin 2019
Paradoxically, it does not appear as if the increase in revenue is at par with government’s expenditure profile. As a matter of fact, government’s expenditure pattern has overtaken her income profile such that the nation is now engaged in deficit financing. The federal government of Nigeria has resorted to external and domestic borrowings in spite of the enormous resources at her disposal. This is certainly not good enough as depicted in graph 1 below:
Figure 1: External and domestic borrowings of Nigeria
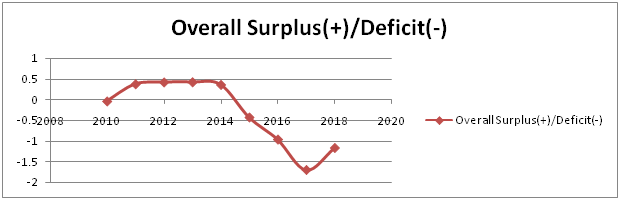
Source: CBN statistical bulletin 2019
Okunroumu (1993), pointed that attempts at managing Nigeria’s economy in order to achieve macroeconomic stability has proved unproductive and negative; hence one cannot say that the economy is performing or doing well. This is evident in high inflationary trend, rippling foreign exchange rates as well as increasing unemployment rates which are all symptoms of macroeconomic instability. All these have culminated into a systematic rise and fall of the country’s Gross domestic Product (GDP) as depicted in graph2 below:
Figure 2: GDP growth rate in Nigeria
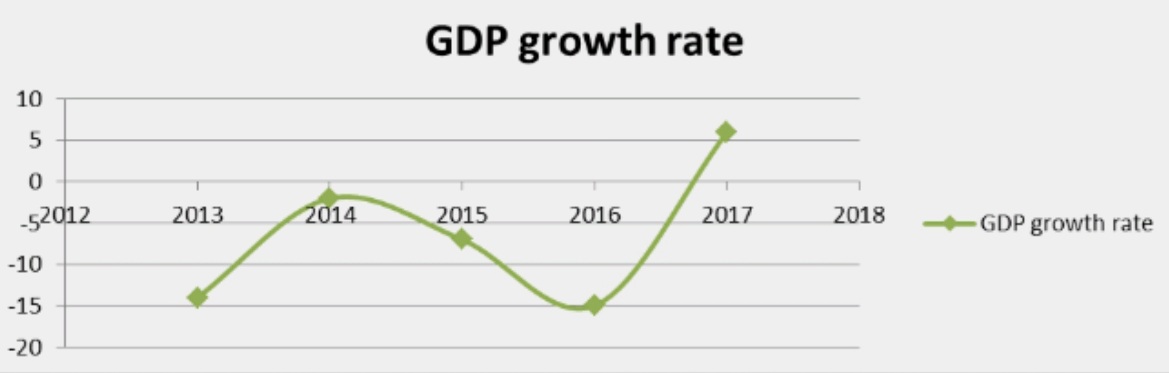
Source: CBN statistical bulletin 2018
The above fluctuating growth statistics are quite disturbing. It is far from being satisfactory and calls for an in-depth review of the not too impressive performance of the Nigerian economy. (Odia and Omofonmwan, 2007).
Furthermore, a dispassionate review of Nigeria’s national budget indicates that it has been on the increase with very little to show for it in terms of economic growth and development. From a budget size of N677 billion in 2000; Nigeria’s budget jumped to N3.93 trillion in 2010 which is an increase of about 399% in a 10 year period. However, the budget crossed the trillion Naira mark for the first time in 2005 with a sum of N1.35 trillion. It increased to N4.99 trillion in 2013 and N6.07 trillion in 2016 and N9.12 trillion in 2018. Budgets are prepared annually but there doesn’t seem to be a mechanism put in place to scrutinize and monitor appropriately the budget implementation.
Table 3: Nigeria’s National budget
| Year | 2000 | 2005 | 2010 | 2013 | 2016 | 2018 |
| Budget | N677 billion | N1.35 trillion | N3.93 trillion | N4.99 trillion | N6.07 trillion | N9.12 trillion |
Source: Nigeria’s 2018 budget - Nairametric.
Other pointers to showcase the seeming poor handling of Nigeria’s public sector finance include the Corruption Perception Index (CPI). .Nigeria’s rating on this index has remained poor and is deteriorating by the year. A corruption perception index ranks countries and Territories based on how corrupt their public sector is perceived to be. A country rank indicates its position relative to other countries in the index. Corruption Rank for Nigeria deteriorated to 149 out of 180 countries in 2020 from 146 in 2019. See figure 3 below.
Figure 3: Nigeria’s corruption perception index/ rank

Source: Trading Economics
On the issue of public procurement, which is an integral aspect of public sector financial management, the nation has not fared better either. According to Kanu, Ozurumba and Akuwudike (2020), year in and year out, public sector procurements run into millions of Naira and yet those procurements are never successfully delivered. There have been upward reviews of contract prices and yet these contracts are never delivered as planned. It is pertinent to mention here, that before such procurements are made adequate planning are usually carried out but at the end of the day, the envisaged procurements are never successfully carried out even at the new increased costs. Sometimes, there are total abandonments of the procurements in question. The societal problems which the procurements were supposed to take care of are left unattended to. Thus, losses are incurred via expended costs as well as the lost opportunities through the misuse of societal reserves. On the other hand, private sector performances are usually achieved within the envisaged resource expenditure. What an irony of fate.
Other indicators like the ease of doing business and capacity utilization are equally exhibiting a downward trend as seen in the table below:
Table 4: Trends of ease of doing business and capacity utilization in Nigeria
| Last | Previous | Highest | Lowest |
| Ease of Doing Business | 131.00 | 146.00 | 170.00 |
| Capacity Utilization | 45.40 | 43.80 | 60.50 |
Source: Trading Economics
One can go on and on, but the truth must be said that following the re-emergence of Nigeria into democratic governance in 1999, the new government inherited external debt overhang of over $30billion, poor infrastructure, and high level of corruption, low accountability and transparency. Public sector financial management was slack. There was lack of accountability and transparency, corruption was at its peak and service delivery very inefficient. Before this time, the Nigerian economy had been highly volatile, with loose fiscal policy and poor management of both the volatility and the fiscal policy. There was no clear and consistent budgetary framework put in place to harness the budgetary process (Zubairu; 2016). That is the bane of the Nigeria society!
Past studies seem to be in agreement on the effect of poor public sector financial management on different economies (Kapur and singer, 2006 and Anuya, 2010). The consensus among these scholars is that weak public sector financial management brings about fiscal deficits with their attendant myriads of problems. This therefore re-enforces the need to empirically investigate this ugly trend in public sector financial management in Nigeria. This forms the crux of our present study.
1.3 Objectives of the Study
Centrally, the study is intended to ascertain the relationship between public sector financial management and the economic growth of Nigeria. It is set to scrutinize and to ensure accuracy, effectiveness and efficiency of government revenue and expenditure. It will investigate the seeming mismatch between resource generation, resource allocation and expenditure management in Nigeria. The specific objectives are to determine:
- Effect of ill disbursement of public funds on economic growth.
- Influence of capital expenditures on economic growth.
- Effect of disaggregated components of capital expenditures on economic growth
- Influence of recurrent expenditures on economic growth.
- Effect of disaggregated components of recurrent expenditures on economic growth]
1.4. Research Question
The following research questions are considered relevant to the study:
- What is nature of the relationship between disbursement of public funds and the level of economic growth in Nigeria?
- To what extent has capital expenditures affected the level of economic growth in Nigeria?
- What is the level of influence of disaggregated components of capital expenditures on the economic growth of Nigeria?
- To what extent has recurrent expenditures affected the level of economic growth in Nigeria?
- What is the level of influence of disaggregated components of recurrent expenditures on the economic growth of Nigeria?
1.5. Hypotheses of the Study
HO1: Public revenues are not appropriately harnessed to create a positive impact on the economic growth of Nigeria.
HO2: There is no significant long run relationship between capital expenditures and the level of economic growth in Nigeria
HO3: Capital expenditures individually do not have any significant impact on the level of economic growth in Nigeria.
HO4: There is no significant long run relationship between recurrent expenditures and the level of economic growth in Nigeria
HO5: Recurrent expenditures individually do not have any significant impact on the level of economic growth in Nigeria
1.6 Significance of the Study
This research will be of immense interest to policy makers. It will give a boost to the ongoing reform agenda on public sector financial management in Nigeria.
1.7 Scope of the Study
The subject of discussions is an interesting broad field of study. We shall limit our focus on Nigeria and the period of investigation is delineated from 1981 to 2018, a total of 38 years.
2. Literature Review
2.1 Conceptual Framework
Conceptual framework of this study is based on the variables that have to do with public sector financial management in Nigeria. This includes:
- Public revenue
- Public expenditures
- The impact of government’s expenditure
- Public procurement
- Stages of public sector financial management in Nigeria
- The need for public sector financial management reforms in Nigeria
These are briefly discussed below:
Public Revenue
Public revenue according to Stephen and Osagie (1985) is concerned with the various ways in which the government raises revenue. Government has different sources for raising the money that she needs for carrying out the various state functions require of it Broadly the sources of government revenue can be classified into two namely tax revenue an non tax revenue.
Public Expenditures
Public expenditure refers broadly to expenditures made by local, state and national government agencies as distinct from those of private individuals, organization and firms. Public expenditures may be classified in 5 different ways: B y levels of government (i.e. LOG classification), by ministries, Extra –ministerial departments and parastatals (i.e. MEP classification) and by economic life span (i.e. ELS classification), others are by object of expenditure (i.e. OBEX classification) and by Sectoral Economic (i.e. SEF Classification).
In this study our focus will be on Economic life span (ELS) and Sectoral Economic (SEF) Classifications.
Under the Economic life span classification, expenditures are further divided into recurrent and capital expenditures. This is in recognition of the timing frequency of disbursement decision. A recurrent expense is made frequently or regularly. In the context of government financial management, recurrent expenditure has an economic life span of less than one year hence in governmental budget. It is repeated annually. A capital expense as earlier implied has an economic life span beyond a year .It is made for purpose of acquiring or improving on a fixed asset.
On the other hand, Sectoral Economic (SEF) Classification is subdivided into 4 different classifications. They are: The Administrative, Economic, Social and community services and Transfers ( Anyafor :1996).
The impact of government’s expenditure
Government expenditure produces different degrees of impact on the economy. The effect varies greatly, depending on how the government disburses public funds. If not undermined by poor management and fiscal indiscipline, government’s expenditure is expected to have a positive impact on resource allocation that is on the pattern of goods and services produced by the economy. It is also expected to produce major consequences on the distribution of real income and welfare. Since many of government expenditure benefit some groups at the expense of others, the consequence is income distribution.
Seeing that government’s income was not being equitably distributed to produce the dividends of good governance marked the beginning of agitations for reforms in public sector financial management
Public Procurements:
According to the World Bank (2015), public procurement is the process by which governments and other publicly funded entities acquire goods, works, and services needed to implement public projects. It accounts for at least 15% of the world’s gross domestic product (GDP), and even more in African countries.
In Nigeria, public procurement is a major activity of government that generates important financial resources and has been viewed as part of a wider reform agenda targeted at improving public financial management. The public procurement Act was enacted and promulgated by the federal government of Nigeria in 2007.This was further amended in 2018 to reflect the realities on ground. Its intention amongst other things is to bring sanity and conformity to public procurement by instituting bodies and principles that harmonizes the public procurement process and activities (Kanu, Ozurumba and Akuwudike (2020).
Stages of public sector financial management in Nigeria
According to Onuorah and Appah (2012), the various stages of public financial management include:
- Policy formulation: This is designed to achieve certain micro and macroeconomic policies. It entails a clearly defined structured and articulated system that moves to promote cost-consciousness in the use of resources. The government needs to have an estimate of revenue and expenditure to achieve the policy objective of government.
- Budget formulation: This step involves the allocation of resources before the submission to the legislature for review and final approval.
- Budget structures: This addresses the question of how the budget is or should be composed of in Nigeria; budgets have revenues and expenditure sides.
- Payments system: This involves the operational procedures for receiving monies for the public and for making payments to them. The mode of payment in Nigeria includes book adjustments, issue of cheques, and payment authorities and electronic payment systems.
- Government accounting and financial reporting: Government financial reports should be prepared with the objective in mind of providing full disclosure on a timely basis of all material facts relating to government financial position and operations..
- Audit: One of the fundamental aspects of public sector financial management in Nigeria is the issue of audit of government financial reports. The high level of corruption in the public sector of Nigeria is basically as a result of the failure of auditing. in the Nigerian public sector.
- Legislative control: .This is the responsibility of the members of the National Assembly to ensure that the budget estimates are properly scrutinized to ensure accuracy, effectiveness and efficiency of government revenue and expenditure
The need for public sector financial management reforms in Nigeria
The Federal Government of Nigeria began public finance management reforms to address the challenges of transparency, accountability, debasement, and helpless service delivery. This became necessary as the nation had not made a lot of progress in its economic development efforts due to the following chronic and deep seated challenges:
- Deficiencies in planning and budgeting system
- Huge wage bill and absence of information base of government employees
- Low capital spending
- Inefficiency
- Transparency and accountability
- Tracking revenues and expenditures
- Strengthening Internal controls system.
- Deficiencies in financial, accounting and budget reporting
- Antiquated accounting and evaluating system
- Inadequate use of modern ICT infrastructure for public financial management.
- Compliance with international best practice as globalization restricts the capacity of governments’ to act independently.
- High cost of governance. About 60% of annual budget spent on recurrent expenditure.
- Poor cash management and resource portion
- High domestic debts and associated costs.
- Dependency on oil revenues with its unpredictability effect on budget implementation
- Corruption
- Enough value was not place on public spending
Consequently in 2004, Nigeria embarked on Economic Reforms and Governance Project (ERGP) sponsored by the World Bank to address the challenges. This led to the presentation of Integrated Payroll and Personnel Information System (IPPIS), Government Integrated Financial Management Information System (GIFMIS), Treasury Single Account (TSA), E-Payment, and International Public Sector Accounting Standards (IPSAS).
Some legislation has additionally been enacted in the areas of financial responsibility and public procurements. The implementation of these reforms is beginning to yield results. It, however, requires sustained political will, commitments, limit enhancement, and subsidizing for the district to reap the full benefits of these reforms
2.2 Theoretical Framework
Below are some of the nationally acclaimed principles of public expenditure and fiscal discipline:
Principle of Economy
Under this principle, officers controlling public expenditure are required to exercise due care. Money must not be spent merely because it has been voted for . Principle of economy in public expenditure advocates that all wasteful and unnecessary expenditures should be avoided. Duplication or overlapping of government’s functions and activities that may result in government funds being wasted must be severely checked.
Principle of sanction
This principle states that financial warrants must be obtained as an authority to incur expenditure prior to committal of public funds. An authority to incur expense is a delegation to a schedule officer to incur an expenditure on behalf of the government in accordance with approved budget votes. Sanction simply means an approval given by a superior authority.
Principle of maximum social advantage
This principle advocates that public expenditure should be made in such a way that the welfare of the society is maximized. For this purpose therefore, government expenditure which promotes greater welfare should be preferred to that which brings about less welfare. Welfare in this context implies a condition of having comfortable living and conducive enabling environment for personal endeavors and good health.
Principle of strict budget discipline
An important guiding principle of public expenditure is the philosophy of strict budget discipline whereby all levels of government should confine themselves to the limit of expenditure in the approved estimate/ supplementary estimate. The principle advocates for a balanced budget as an important cornerstone of budget discipline. It requires that aggregate expenditure should be equal or preferably less than prudently determined aggregate revenue. By virtue of the principle of budget discipline, extra budgetary expenditures are not tolerated but that has become the order of the day!
Economic growth
Since economic growth is on the flip side of this discuss, we shall briefly mention some of the theoretical frameworks surrounding economic growth .This includes the Classical Growth Models,, Marxian theory of growth and Rowstow’s stages of growth theory. Others are the Keynesian Growth Model, Neoclassical Growth Model and the Endogenous Growth Model.
2.3 Empirical Review
Olaoye and olaniyan (2020) investigated the relationship between total public expenditure, total federally-collected revenue, public borrowing, public debt services and real gross domestic product of Nigeria from 1986 to 2016. This study adopted the ex-post facto research design. Error correction model was used to analyze the data. The study revealed among other things that; there is the presence of co-integration (long-run relationship) among the variables in the model, actual public debt service and total public borrowing has significant relationship with economic growth of Nigeria, while total public expenditure and total federally-collected revenue are not significantly related to economic growth in the long run. The study concluded that there is a significant relationship between public financial management and the economic growth of Nigeria, depending on the variable of interest. Likewise, the study recommended among other things that government should ensure efficiency and effectiveness in the public financial management due to the insignificant influence of public expenditure on economic growth both in the long and short runs which is a pure indication of poor public financial management in the country. Also, the component governments in Nigeria should reduce its public borrowing as it has a significant inverse effect on the economic growth of the country in the long run.
Morakinyo, David and Alao (2018) found out that recurrent expenditure had a long-run positive influence on the economic growth, while capital expenditure had a negative relationship.
Nwokorie (2017) studied the challenges to effective management of public sector organizations and revealed that managers from various organizations indulged in networking activities for the attainment of projected levels and positions, at the detriment of the organization’s career success. Using dynamic vector autoregressive regression, Iheanacho (2016) studied the impact of government expenditure to economic growth in the country and found out that high government expenditures are sources of economic instabilities.
Jumare, Yusuf and Mohammed (2015) used OLS to analyze the impact of government expenditure on economic growth and disclosed that a negative and insignificant relationship exists between physical capital and economic growth, while there is a positive but insignificant relationship between government capital expenditure and economic growth in the country.
Odior and Alenoghena (2014) studied the causality relationship between public sector financial management and output growth. It was found out that poor financial management in the public sector and continuing diversion of funds from the system has hindered positive benefaction from some key economic sectors of the economy.
Okpala,(2012) examined fiscal accountability dilemma in the public sector with the use of questionnaire. The study showed that poor accountability in Nigeria due to inefficient accounting facilities and incompetent government officials.
Onuorah and Appah(2012) examined the management of public assets in terms of how public office holders give accountability report of their stewardship. Information on federal and state government revenue and expenditure, profiles were collected from Statistical bulletin of the Central Bank of Nigeria from 1961-2008. The results were analyzed utilizing relevant measurable instruments. The discoveries reveals that the level of accountability is very poor in Nigeria because the attributes of accessibility, comprehensiveness, relevance, quality, reliability and timely disclosure of economic, social and political information about government activities are completely non available
Abata and Adejuwon (2012) examine the importance of financial transparency and accountability in Nigeria's restoration. It noted that an improved public financial management and accountability environment has become significant to better governance and performance. The paper present ideas and principles that can help public managers understand their commitments toward financial management. It concludes with viable, constructive ideas for restoring Nigeria on the way of financial transparency and accountability
3. Methodology
An ex-post facto research design was adopted in this study. An ordinary least square (OLS) regression analysis as well as A Vector Auto Regression (VAR) analysis and descriptive statistics were used in the model estimation of a time-series data. Real Gross Domestic Product is taken as the proxy for economic growth, while capital and recurrent expenditures constitute the independent variables. The independent variables are in turn disaggregated unto four different components namely administrative, Economic, Social and Community sectors and Transfers. All these are captured in the models below:
TOTREV = f (CAPEX + RECEX).
CAPEX = f (Admin + Socoms + Econs + Trans)
RECEX= f (Admin + Socoms + Econs + Trans)
RGDP= f CAPEX (Admin + Socoms + Econs + Trans) + e
RGDP= f RECEX (Admin + Socoms + Econs + Trans) + e
Where:
TOTREV = Total Revenue
CAPEX = capital expenditure
RGDP = Real Gross Domestic product; a proxy for economic growth in Nigeria
ADMIN = Administrative service
SOCOMS = Social and community services
ECONS = Economic services
TRANS = Transfers.
e = Error term
3.2 Explanation / Justification of the Chosen Variables
The key concepts underlying this study are briefly discussed below:
Recurrent Expenditure
This type of expense is made frequently or regularly. In the context of government financial management, recurrent expenditure has an economic life span of less than one year hence in governmental budget. It is repeated annually.
Capital Expenditure
This has an economic life span beyond a year .It is made for purpose of acquiring or improving on a fixed asset.
The Administrative sector
This reflects expenditures on defense, internal security and general administration.
Economic service sector
This has to do with expenditures on agriculture, and natural resources, construction, manufacturing / mining/ quarrying, transport and communication, special projects and others.
Social and community services
This captures the expenses on education, health, housing and others.
Transfers
These are disaggregated into public debt, interest charges, capital repayments, external financing obligations, pensions and gratuities and others.
3.3 Expected or Apriori Expectations
Capital expenditures are expected to have a positive impact on economic growth. Upon disaggregation; expense on economic, administrative, social and community matters are also expected to have a positive impact on economic growth since they have a direct link to the provision of basic amenities. Transfers and recurrent expenditures are expected to impact negatively on economic growth since they have to do with servicing of debts and payment of salaries /personal emoluments respectively.
4. Data Estimation
Preliminary Tests
Figure 4: Normality Test
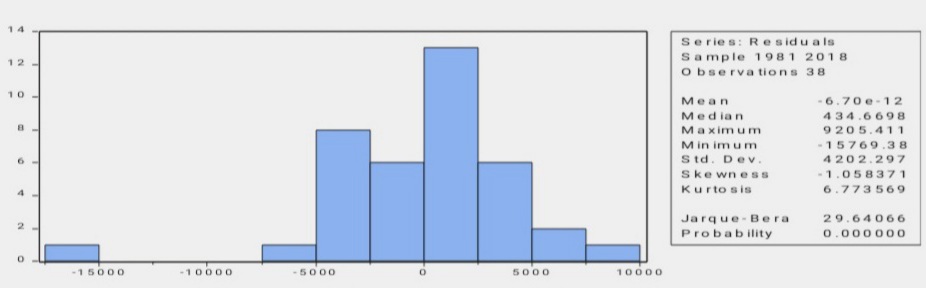
Source: E-view statistical package version 9
Table 5: Heteroskedasticity Test: White
| F-statistic | 13.58239 | Prob. F(5,32) | 0.0000 | |||
| dObs*R-squared | 25.82928 | Prob. Chi-Square(5) | 0.0001 | |||
| Scaled explained SS | 63.25511 | Prob. Chi-Square(5) | 0.0000 | |||
| Breusch-Godfrey Serial Correlation LM Test: | ||||||
| F-statistic | 20.41950 | Prob. F(2,33) | 0.0000 | |||
| Obs*R-squared | 21.01710 | Prob. Chi-Square(2) | 0.0000 | |||
| Source: E-views statistical package version 9 Ramsey RESET Test |
||||||
| Value | df | Probability | ||||
| t-statistic | 10.24921 | 34 | 0.0000 | |||
| F-statistic | 105.0463 | (1, 34) | 0.0000 | |||
| Likelihood ratio | 53.52096 | 1 | 0.0000 | |||
Figure 4 and table 5 above shows the pattern of time series. The variables are not normally distributed. The probability values are less than the critical value at 5%..The Null hypothesis is rejected in favor of the alternate that, the variables are homoscedasticity in pattern, not serially correlated and stable for prediction.
Table 6: Summary of unit root test
|
|
T-Stat | Critical value @1 % | Critical value @5 % | Critical value @10 % | Order of co-integration | Sig. |
| RGDP | -6.46 | -3.63 | -2.95 | -2.61 | 2nd diff | Sig. |
| TOTREV | -5.64 | -3.67 | -2.96 | -2.62 | 2nd diff | Sig. |
| CAPEX | -12.52 | -3.63 | -2.95 | -2.61 | 2nd diff | Sig. |
| RECEX | -4.88 | -3.67 | -2.97 | -2.62 | 2nd diff | Sig. |
Source: Culled from E-view statistical package version 9
Table 6 is a summary of the unit root tests. The result shows that all the variables turned stationary at second difference. They are all significant at 1% Alpha level.
Table 7: Co-integration test
| Variable | No. of co-integrating equations( Trace Test | No. of co-integrating equations (Maximum –Eigen value Test) |
Nature of Equilibrium |
| RGDP, TOTAL REVENUE, CAPEX, RECEX |
Trace test indicates 3 co-integrating equations at the 0.05 level | Maximum –Eigen value test indicates 1 co-integrating equation at the 0.05 level | Long run |
Source: Culled from E-view statistical package version 9
The result of the Johansen’s cointegration test as presented in Table 7 above shows the existence of co- integrating equations. This shows that there exist a long run equilibrium relationship between RGDP and the other variables used in the model.
Test of hypothesis 1: Public revenues are not appropriately harnessed to create a positive impact on the economic growth of Nigeria
Table 8: Descriptive statistics on Total Revenue, Capital and Recurrent Expenditure profiles of Nigeria
| REVENUE | CAPEX | RECEX | |
| Mean | 3281.560 | 428.1213 | 1286.976 |
| Median | 1340.395 | 289.3350 | 455.6300 |
| Maximum | 11116.85 | 1682.100 | 5675.190 |
| Minimum | 10.51000 | 4.100000 | 4.750000 |
| Std. Dev. | 3763.761 | 445.0379 | 1637.929 |
| Skewness | 0.763525 | 0.904065 | 1.119581 |
| Kurtosis | 2.110141 | 2.965618 | 2.981852 |
| Jarque-Bera | 4.945909 | 5.178319 | 7.939115 |
| Probability | 0.084335 | 0.075083 | 0.018882 |
| Sum | 124699.3 | 16268.61 | 48905.08 |
| Sum Sq. Dev. | 5.24E+08 | 7328174. | 99264010 |
| Observations | 38 | 38 | 38 |
Source: E-view statistical package version 9
From 1981 to 2018, the sum of N124, 699.3 billion was generated as revenue. Of this amount, the sum of N48, 905.08 billion was spent on recurrent expenditure as against N16, 268.61 spent on capital expenditure. The amount spent on recurrent expenditures is more than three times that of capital expenditure. One can say it without fear of contradiction that the nations financing option is skewed towards payment of salaries and personnel emoluments (Recurrent Expenditures) as against the provision of basic infrastructures, that are growth oriented. Ironically, this is for a nation that is aspiring to grow and become developed. Thus, we accept the null hypothesis that Public revenues are not appropriately harnessed to create a favorable and positive impact on the economic growth of Nigeria.
Test of hypothesis 2: There is no significant long run relationship between capital expenditures and the level of economic growth in Nigeria.
Table 9: Summary of global statistics: Ordinary Least Square (OLS) and Auto-Regressive Model (VAR)
| Test Statistics | Model 1 (OLS) | Model 1 (VAR) |
| R-Square | 0.829116 | 0.997964 |
| Adjusted R square | 0.824369 | 0.997773 |
| S.E .Regression | 8204.860 | 925.1026 |
| Sum Squared Residual | 2.42E+09 | 27386072 |
| Log likelihood | -395.3667 | -294.8383 |
| Durbin Watson Statistics | 0.777691 | 2.345720 |
| Mean dependence variance | 33725.24 | 34758.75 |
| S .d dependence variance | 19578.12 | 19604.34 |
| Akaike Infor Criterion | 20.91404 | 16.60213 |
| Schwarz Criterion | 21.00023 | 16.77807 |
| F- statistics | 174.6694 | 5228.610 |
| Prob (F- statistics) | 0.000000 | 0.000000 |
Source: Culled from the output of E-view statistical package 9
In the short run, OLS model posted an R-Square of 82.9% and an Adjusted R-Square of 82.4%. In order to confirm the specification status of our model, we employ the analysis of variance or ANOVA, for short. Since F-ratio calculated (174.67) is greater than F-ratio critical at both 1% and 5% Alpha levels. We conclude thus; that the aggregated components of capital expenditures have a significant short run relationship with the level of economic growth in Nigeria.
In the long run, the VAR model posted an R-Square of 99.8%, and an Adjusted R-Square of 99.78. Applying the rule of ANOVA, since F-ratio calculated (5228.6) is greater than F-ratio critical at both 1% and 5% Alpha levels,. Thus, we reject H02 and conclude that the aggregated components of capital expenditures have a significant short run relationship with economic growth in Nigeria.
Test of hypothesis 3: Capital expenditures individually do not have any significant long run impact on the level of economic growth In Nigeria.
Regression analysis between RGDP and the disaggregated components of CAPEX in the short run:
Table 10: T-statistics table in the short run
| Variable | Coefficient | Std. Error | t-Statistic | Prob. |
| C | 17675.14 | 1761.225 | 10.03571 | 0.0000 |
| ADMIN | 162.0688 | 51.48140 | 3.148105 | 0.0035 |
| ECONS | -21.89926 | 22.91910 | -0.955503 | 0.3463 |
| SOCOM | -24.61439 | 93.70892 | -0.262669 | 0.7944 |
| TRANS | 65.70497 | 23.90040 | 2.749116 | 0.0096 |
Source: Culled from the output of E-view statistical package 9
From table 6 above, expenses incurred in the administrative sector (defense, internal security and general administration) and transfers ( public debt, interest charges, capital repayment, external financial obligations, pensions and gratuities and others) proved to have a positive significant relationship with economic growth in Nigeria in the short run, while the Economic sector (agriculture and natural resources, construction, manufacturing/ mining /quarrying, transport and communication , special projects and others) and Social and community service sector ( education , health, housing and others) maintained an inverse relationship( though not statistically significant ) with economic growth in the short run.
Regression analysis between RGDP and the disaggregated components of CAPEX in the long run.
Table 11: T-statistics table in the long run
| Variable | Coefficient | Std. Error | t-Statistic | Prob. |
| C | 1005.680 | 407.6654 | 2.466924 | 0.0198 |
| ECONS | 0.861150 | 2.702864 | 0.318606 | 0.7523 |
| ADMIN | 4.134076 | 6.783260 | 0.609453 | 0.5470 |
| SOCOMS | 10.04347 | 10.87422 | 0.923603 | 0.3633 |
| TRANS | -3.516344 | 3.285329 | -1.070317 | 0.2933 |
| RGDP(-1) | 1.578965 | 0.117182 | 13.47449 | 0.0000 |
| RGDP(-2) | -0.620367 | 0.121681 | -5.098310 | 0.0000 |
Source: E-view statistical package 9
From table 11 above, the lagged value of RGDP in the first year was found to have a positive significant relationship with economic growth. In the second year it turned negative. Other disaggregated component of CAPEX did not have a significant relationship with economic growth in the long run. To further buttress the above assertion, the descriptive statistics below refers.
Table 12: Descriptive statistics
| CAPEX | ADMIN | ECONS | SOCOM | TRANS | |
| Mean | 426.2250 | 107.9845 | 200.5026 | 53.09737 | 64.63737 |
| Median | 289.3350 | 49.40000 | 168.6650 | 25.67000 | 28.15500 |
| Maximum | 1682.100 | 446.2500 | 753.4900 | 203.4200 | 278.9400 |
| Minimum | 4.100000 | 0.260000 | 0.660000 | 0.240000 | 0.000000 |
| Std. Dev. | 441.8836 | 122.4400 | 201.2669 | 61.39236 | 80.64475 |
| Skewness | 0.901379 | 0.887982 | 0.732904 | 0.912535 | 1.354643 |
| Kurtosis | 2.989486 | 2.723382 | 2.716809 | 2.493114 | 3.580123 |
| Jarque-Bera | 5.145905 | 5.115062 | 3.528916 | 5.680702 | 12.15489 |
| Probability | 0.076310 | 0.077496 | 0.171280 | 0.058405 | 0.002294 |
| Sum | 16196.55 | 4103.410 | 7619.100 | 2017.700 | 2456.220 |
| Sum Sq. Dev. | 7224661. | 554687.9 | 1498809. | 139453.8 | 240632.3 |
| Observations | 38 | 38 | 38 | 38 | 38 |
Source: E-view statistical package 9
From 1981 to 2018, a total sum of N16, 196.55 billion was spent on capital expenditures. This is split in the ratio of 25% to Admin, 47%, to Economic services, 12% to Social and community services and 16% to transfers. All these have proved to be insufficient, and thus could not have impacted significantly on economic growth in Nigeria.
Test of hypothesis 4: There is no significant long run relationship between recurrent expenditures and the level of economic growth in Nigeria
Table 13: Summary of global statistics: Ordinary Least Square (OLS) and Auto-Regressive Model (VAR)
| Test Statistics | Model 1 (OLS) | Model 1 (VAR) |
| R-Square | 0.964294 | 0.997876 |
| Adjusted R square | 0.959966 | 0.997436 |
| S.E .Regression | 3917.295 | 992.6657 |
| Sum Squared Residual | 5.06E+08 | 28576172 |
| Log likelihood | -365.6191 | -295.6040 |
| Durbin Watson Statistics | 0.811451. | 0.809480 |
| Mean dependence variance | 33725.24 | 34224.35 |
| S .d dependence variance | 19578.12 | 19601.55 |
| Akaike Infor Criterion | 19.50627 | 17.33253 |
| Schwarz Criterion | 19.72174 | 17.46314 |
| F- statistics | 222.8027 | 3772.754 |
| Prob (F- statistics) | 0.000000 | 0.000000 |
Source: Culled from the output of E-view statistical package 9
In the short run, OLS model posted an R-Square of 96.4% and an Adjusted R-Square of 95.9 %. In order to confirm the specification status of our model, we employ the analysis of variance or ANOVA, for short. Since F-ratio calculated (222.8) is greater than F-ratio critical, at both 1% and 5% Alpha levels. We conclude thus; that recurrent expenditures have a significant short run relationship with the level of economic growth in Nigeria.
In the long run, the VAR model posted an R-Square of 99.8%, and an Adjusted R-Square of 99.7. Applying the rule of ANOVA, since F-ratio calculated (3772.7) is greater than F-ratio critical at both 1% and 5% Alpha levels,. Thus, we reject H02 and conclude that the disaggregated components of recurrent expenditures have a significant long run relationship with economic growth in Nigeria.
Test of hypothesis 5: Recurrent expenditures individually do not have any significant long run impact on the level of economic growth in Nigeria.
Regression analysis between RGDP and the components of RECEX in the short run:
Table 14: T-statistics table in the short run
| Variable | Coefficient | Std. Error | t-Statistic | Prob. |
| C | 18087.32 | 864.7387 | 20.91652 | 0.0000 |
| ADMIN | 33.12079 | 9.576047 | 3.458712 | 0.0015 |
| SOCOMS | 1.863911 | 10.83242 | 0.172068 | 0.8644 |
| ECONS | 1.759791 | 11.41956 | 0.154103 | 0.8785 |
| TRANS | 2.460577 | 3.110486 | 0.791059 | 0.4346 |
Source: E-view statistical package 9
From table 14 above, It was only the expenses incurred in administrative service sector that proved to have a positive significant relationship with economic growth in Nigeria in the short run.
Regression analysis between RGDP and the disaggregated components of RECEX in the long run
Table 15: T-statistics table in the long run
| Variable | Coefficient | Std. Error | t-Statistic | Prob. |
| C | 774.0013 | 971.5050 | 0.796703 | 0.4321 |
| ADMIN | -2.914795 | 3.152740 | -0.924527 | 0.3628 |
| SOCOMS | 2.571249 | 3.253353 | 0.790338 | 0.4357 |
| ECONS | 7.099723 | 2.944668 | 2.411044 | 0.0225 |
| TRANS | 0.135408 | 1.020207 | 0.132726 | 0.8953 |
| RGDP(-1) | 1.669722 | 0.176182 | 9.477238 | 0.0000 |
| RGDP(-2) | -0.687753 | 0.193704 | -3.550535 | 0.0013 |
Source: E-view statistical package 9
From table 15 above, the expense on economic service sector and the lagged value of RGDP taken as an explanatory variable were found to have a positive significant relationship with economic growth. RGDP became significantly negative in the second lag. To further buttress the above assertion, is a descriptive test on the disaggregated components of RECEX as contained in table 16 below:
Table 16: Descriptive test on the disaggregated components of RECEX
| RECEX | ADMIN | ECONS | SOCOMS | TRANS | |
| Mean | 1281.756 | 414.6134 | 115.4526 | 246.6497 | 505.0389 |
| Median | 455.6300 | 162.6650 | 40.77000 | 75.50000 | 155.6350 |
| Maximum | 5675.200 | 1584.060 | 562.7500 | 1083.730 | 2634.860 |
| Minimum | 4.750000 | 0.900000 | 0.170000 | 0.290000 | 3.390000 |
| Std. Dev. | 1620.678 | 507.6861 | 152.0103 | 339.9814 | 667.8266 |
| Skewness | 1.122536 | 0.900580 | 1.182963 | 1.163186 | 1.573541 |
| Kurtosis | 3.047088 | 2.280988 | 3.350554 | 2.778554 | 4.860439 |
| Jarque-Bera | 7.984061 | 5.955164 | 9.057445 | 8.646654 | 21.16182 |
| Probability | 0.018462 | 0.050916 | 0.010794 | 0.013256 | 0.000025 |
| Sum | 48706.72 | 15755.31 | 4387.200 | 9372.690 | 19191.48 |
| Sum Sq. Dev. | 97184118 | 9536571. | 854964.0 | 4276731. | 16501717 |
| Observations | 38 | 38 | 38 | 38 | 38 |
Source: E-view statistical package 9
From 1981 to 2018, a total sum of N 48, 706.72 billion was spent on recurrent expenditures, split in the ratio of 16 % to Administration, 4 %, to Economic services, 9% to Social and community services and 19% to transfers.
5. Discussion of Findings
Apparently one can say authoritatively without fear of contradiction that the nations financing option is skewed towards payment of salaries and personnel emoluments (Recurrent Expenditures) as against the provision of basic infrastructures, that are growth oriented. The trend of disbursements is not appropriately harnessed to create a favorable and positive impact on the economic growth. In other words, Nigeria is yet to get it right in terms of her public sector financial management.
6. Summary of Research Findings
The outcomes of this study revealed some important findings which are discussed below:
- The aggregated components of capital expenditures have a significant short run relationship with the level of economic growth in Nigeria.
- Expenses incurred by the Economic sector and Social and community service sector maintained an inverse relationship (though not statistically significant) with economic growth in the short run while expenses incurred in administration and transfers proved to have a positive significant relationship
- The disaggregated component of RECEX indicate that expense on economic service sector and the lagged value of RGDP at the first lag taken as an explanatory variable were found to have a positive significant relationship with economic growth in the long run.
- The disaggregated component of CAPEX did not have a significant relationship with economic growth in the long run. To buttress this point, from 1981 to 2018, a total sum of N16, 196.55 billion was spent on capital expenditures. This was split in the ratio of 25% to Admin, 47%, to Economic services, 12aref% to Social and community services and 16% to transfers. Allocations to the vital sections of the economy (economic and Social and community services) – heartbeat of the nation’s developmental needs) were not sufficiently funded and thus could not impact significantly on economic growth in Nigeria.
6.1 Policy Implications of Nigeria’s Public Expenditure Structure
We observed that over the 38 year period (1981-2018), covered by this study, the administration sector and external debt service transfers attracted more their fare share of public expenditure to the detriment of the economic and social community welfare services. We hereby advocate for a policy shift from the present protective sectors dominance to productive sectors dominance.
6.2 Recommendations
Based on the above findings of study; it is hereby recommended that conscious efforts should be made by the federal government of Nigeria to scrutinize and monitor budget implementation. Macroeconomic projections should guide the overall level of expenditure. As such, our projections need to be more realistic, internally consistent and based on more accurate and timely information. We must embark on a careful estimation and determination of priorities and to emphasize the need for control over revenue and expenditure so as to enhance critical areas of economic growth and development in Nigeria.
References
- Anuya .F.O. (2010). The impact of tax revenue and public sector financial management on the economic growth of Nigeria (1980- 2006). Unpublished PhD dissertation, federal University of Technology, Owerri.
- Anyafor .A.M.O (1996). Public finance in a developing economy. The Nigerian case, University of Nigeria Enugu campus, B and F publications UNEC.
- Anyanwu J.C (1997). Nigeria Public finance. Joanee Education publishers limited, 51 Awka oad, Box 2791 Onitsha, Nigeria.
- S.I, B.A. Ozurumba and H. Akuwuike (2020). Effectiveness of public procurement act (PPA) in curbing Corruption in the public service in Nigeria. A study of selected MDAs in FCT, Abuja. International j Journal of management science an Business Administration.Vol.7, issue 1. CrossRef
- Ofurum .C.O. (2005). The impact of public expenditures on economic growth: A comparative Analysis of selected Countries (1970- 2000). Unpublished PhD dissertation, federal University of Technology, Owerri.
- Olaoye .F.O.and N.O. Olaniyan (2020). Public Sector financial management an economic growth (study in Nigeria). International journal of economic and business .Vol. 3, issue 1.
- Omolehinwa .E.(2014), Public financial management :Issus and challenges on budgetperformance - Being a paper Presented at ICAN symposium on federal government of Nigeria 2014 budget at MUSON centre , Onikan Lagos.
- Onuorah .A.C and Appah. E. (2012). Accountability and public sector financial management in Nigeria. Arabianj Journal of Business and Management review (OMAN Chapter). CrossRef


