International Journal of Management Science and Business Administration
Volume 3, Issue 3, March 2017, Pages 49-66
Robust Statistical Analysis of Long-Term Performance For Sharia-Compliant Companies in Malaysia Stock Exchange
DOI: 10.18775/ijmsba.1849-5664-5419.2014.33.1006
URL: http://dx.doi.org/10.18775/ijmsba.1849-5664-5419.2014.33.1006
1Nashirah Abu Bakar, 2Sofian Rosbi
1Islamic Business School, College of Business, Universiti Utara Malaysia, Malaysia
2School of Mechatronic Engineering, Universiti Malaysia Perlis, Malaysia
Abstract: In the year of 2016, Malaysia faced with the challenge in instability of economic condition. This situation weakens Malaysian currency that gives direct impact to all economic sectors in Malaysia. Consequently, this situation gives significant impact on the performance of the sharia-compliant companies listed on the Malaysia Stock Exchange. Therefore, this research validates the long-term performance of share price using market adjusted buy and hold return (MABHR). Then, this study performed normality test to check the distribution of data for return and volatility. Next, correlation analysis performed to validate the relationship between return and volatility. The results show that the Solid Automotive Berhad gives the highest rate of return with respect to the market. While UMW Oil and Gas Corporation Berhad shows the lowest rate of return with respect to the market. The finding of this research helps economists to understand the market trend in empirical thinking. In addition, it also helps the investors to understand the market and make the right decision in investing during this challenging situation.
Keywords: Volatility, Data mining, Return, Sharia-compliant companies, Financial engineering
1. Introduction
Initial Public Offerings (IPO) have been widely studied in the financial literature. IPO was issued when the private companies switch to the public company (Darani, 2012). Therefore, companies start raising capital from the new investors. There are many empirical types of research on the anomalies of IPO which are high initial return and the subsequent bad long term returns (Goergen, et al., 2007). Initial return is referred to the first-day return, while the long-term return is referred to the one till five-year returns. Most of the researchers are used three-year performance of return. Assessment of long term perfomance of IPO is an important for company because it is concerned with the risk. The risk is related to return and loss. Thus, company must manage risk efficiently in order to generate high return. The global evidence shows the degree of IPO underpricing is high. A study of Islam, et al. (2010) regarding the average degree of IPO underpricing in Bangladesh found that the degree of IPO underpricing is very high that is 480.72%. While, a study regarding long-term performance of IPO show underperformed indicators (see Drobetz, et al. 2005).
Besides the performance of IPO in short term and long term, the volatility of the companies is important to study. Volatility is referred to the degree of variation of a trading price series over time as measured by the standard deviation. Extreme stock price volatility disrupts the smooth functioning of the financial system and leads to structural or regulatory changes (Becketti and Sellon, 1989).
Past research that focuses on Malaysian IPO shows that IPO of companies experience with the adverse long term performance typically lasts for the first three years after going public. Ahmad Zaluki and Kect (2012) found that during 2002-2005, Malaysia IPO showed an under-performance of -4.31% to -41.74% over the three years after the listing. Similarly, Zarafat and Vejzagic (2014) found an under-performance of -32.8% for companies that went public between 2004 and 2007.
Even there are much research focuses on the long-term performance and volatility of the shares price but it is still lack of researchers that examine the long-term performance and volatility return for sharia-compliant companies. Thus, this paper tries to fulfill this gap by analyzing the long-term performance and volatility of sharia-compliant companies that issues IPO in the year 2013. Specifically, this study examines long-term performance of IPO for sharia-complaint companies using buy and hold returns (BHR) method. This study focuses on sharia-compliant companies due to the outstanding growth of sharia-complaint companies in Malaysia market. Since sharia board is established in Malaysian Stock Exchange (MSE) in 1997, the demands for sharia companies are higher than non-sharia-compliant companies. As reported by Securities Commission (2016) out of 672 companies from 904 companies are sharia-compliant companies. Therefore, it is important to examine the performance of sharia-compliant companies.
2. Literature Review
There is a vast body of literature documenting the long-term performance of IPO in almost all over the world. Among other, Chen et al, (2008) show that Taiwan IPO, that came to the market during the period 1991 to 2007 have a better long-term performance than the market. Drobetz et al. (2005) indicated that long-term performance of Swiss IPOs and found that IPOs underperformed their benchmarks. Kooli and Suret (2004) investigated long-term performance in Canada. Using a data from 1991 to 1998, they found that IPOs underperformed. Some of the factors previously identified to influence long-term performance of IPO included underwriter reputation (Chen and Wang, 2016), information asymmetric (Escobari and Serrano, 2016) and ownership structure (He, et al., 2015).
In Malaysia, Corhay, et al. (2002) examines the long-term performance of IPO in Malaysia over the four-year period between 1992 and 1996. They found that IPO tends to outperform the market with a positive cumulative adjusted market return (CAR) of 41.7% over three years from the listing day. Ahmad-Zaluki et al. (2007) found that significant over performance for equally weighted event time CAR and buy-and-hold returns using two market benchmarks, though not for value-weighted returns or using a matched company benchmarks. The significant abnormal performance also disappeared under the calendar-time approach using the Fama-French three-factor model. While the long run performance of main- and second-board IPO do not differ from the years of listing, issue proceeds, and initial returns found to be performance-related.
Abu Bakar and Rosbi (2016) examined the long-term performance of IPO for sharia-compliant companies listed on the Malaysian Stock Exchange from 2006 until 2010. Using Cumulative Abnormal Return (CAR), this study shows that CAR for equal-weight and value-weight of IPO for sharia-compliant companies is significantly higher over performing by 14.58% and 4.11% respectively in the year 2006. While the results in 2007 (-1.34%) and 2008 (-3.43%) for value–weight are underperformed. This study also found that the underpricing, offer price, offer size, market type, trading/service industry, consumer product industry, property industry and REIT industry were statistically significant. Besides the study that focuses on the long-term performance of IPO, volatility of return also important in determining the performance of the share price. Study focus on the determinants factor of bank performance in China found that the high level of stock market volatility could translate into higher return on equity. Rather than leading to improved profitability, the labor productivity has a negative effect on economic value added (Tan and Floros, 2012).
Ismal (2010) uses Value at Risk (VaR) approach to compute the volatility (risk) of returns and expected losses of Islamic bank financing in Indonesia. He found that the equity and debt-based financing produce sustainable returns of bank financing. He also found that the performance of service-based financing is very sensitive to the economic conditions and finds that risk of investment and expected losses are well managed.
While the study from Floros and Salvador (2016) regarding the effect of trading volume and open interest on the volatility of futures markets found that market depth has an effect on the volatility of future markets but the direction of this effect depends on the type of contract.
Faff and McKenziet (2007) concluded that low or even negative return of autocorrelations is more likely in situations where: return volatility is high; price falls by a large amount; traded stock volumes are high, and the economy is in a recessionary phase. Boonvorachote and Lakmas (2016) investigate the impact of trading activity including trading volume and open interest on price volatility in Asian future exchanges. The results show a positive contemporaneous relationship between expected and unexpected trading volume and volatility, while open interest mitigates volatility.
3. Research Methodology
This objective of this research is to determine the long-term performance of share for companies of that sharia-compliant organizations. Therefore, this research validates the long-term performance of share price using market adjusted buy and hold return (MABHR). Then, this study performed normality test to check the distribution of data for return and volatility. Next, correlation analysis also is performed to validate the relationship between return and volatility
3.1 Derivative Equation for Market Adjusted Buy and Hold Return (MABHR)
In calculating the markets adjusted buy and hold return (MABHR), we need to follow these procedures. Firstly, determine the return for company i of particular trading day d, using Equation (1).
![]()
Ri,d: Return for companyi in period d
PCd: Share Price for company i, in period d
PCd-1: Share Price for company i, in period d-1
Time interval in day.
Then, we calculate the return for a particular company in particular month t, using Equation (2).

Ri,t: Return for company i in particular month t
n: number of trading days in one month
Next, determine the return for reference market of particular trading day d, using Equation (3). In this paper, we selected Kuala Lumpur Stock Exchange (KLSE) as reference market.
Rm,d: Return for market in period d
PMd: Share Price for market in period d
PMd-1: Share Price for market, in period d-1
Time interval in the day
Then, we calculate the return for the market in particular month, using Equation (4).
Ri,t: Return for company i in particular month t
n: number of trading days in one month
Finally, market adjusted buy and holds return for a company i (MABHRi) calculated as Equation (5).
3.2 Derivative for Rate of Return
After the value of MABHR is calculated, this research focused on the statistical analysis for normality test and correlation test. This research implement below equation for the rate of return for share price:
Where Rt is rate of return for period t, Pt is share price at period t and is share price at period t-1.
Then, we calculate the average return for 43 days trading period as below equation:
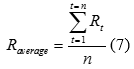
Where raverage is average rate or return for particular selected period, is the rate of return for period t and n is the number of trading days in selected period.
3.3 Derivative of Volatility
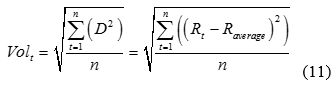
Volatility is a statistical measure of the dispersion of returns for a given security or market index. Volatility measured by using the standard deviation between returns from that same security or market index.
For the volatility, the calculation derives as follow procedure. The deviation of return calculated as below:
![]()
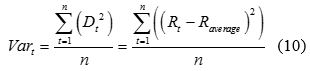
Where raverage is average rate or return for particular selected period and is the rate of return for period t.
Then, the deviation squared,
![]()
Next, the variance for period t calculated as below:
The volatility for period t calculated as below:
3.4 Mathematical Derivative of Pearson Product Moment Correlation Coefficient
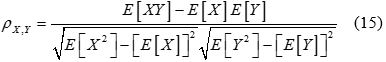
Consider the Pearson product-moment correlation coefficient of two n-dimensional vectors X = {X1, X2,...,Xn} and Y = {Y1,Y2,...,Yn}. Pearson correlation is stated as the ratio between the covariance of X and Y and the product of their standard deviations. Pearson's correlation coefficient, when applied to a population, is commonly represented by below equation:
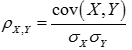
Where cov is the covariance, is the standard deviation of X, and is the standard deviation of Y.
Then, covariance expressed as below:
![]()
where E is the expectation and µx is the mean of X.
Therefore, Equation (12) can be written as
Then, the mathematical equation for ρ can be expressed in terms of uncentered moments. Mean of population is expressed as next equation,
![]()
Variance of population is expressed as next equation,
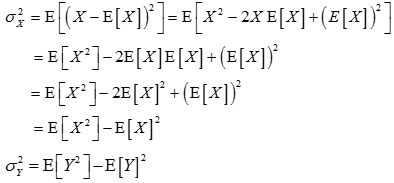
Standard deviation of population is expressed as next equation,
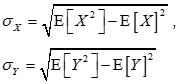
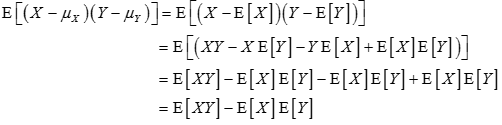
Covariance of population is expressed as next equation,
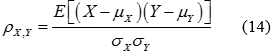
Therefore, Equation (14) can be represented as:
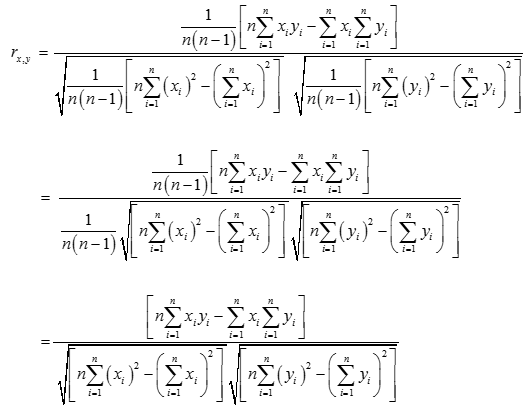
Then, the equation for the sample is derived. Sample Pearson's correlation coefficient is commonly represented by the letter r. Consider the sample of dataset x = {x1,...,xn} containing n values and another dataset y = {y1,...,yn} containing n values then that formula for r is:
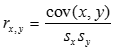
where cov is the covariance, is the standard deviation of x, and is the standard deviation of y.
Then, sample covariance can be expressed as below:
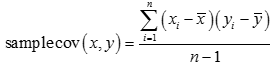
Therefore, Equation (16) can be written as:
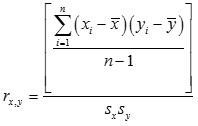
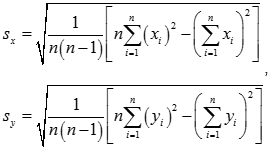
Then, the mathematical equation for r can be expressed in terms of uncentered moments. Mean of sample,
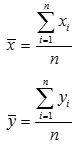
Variance of sample,

Standard deviation of sample,
Covariance of sample,
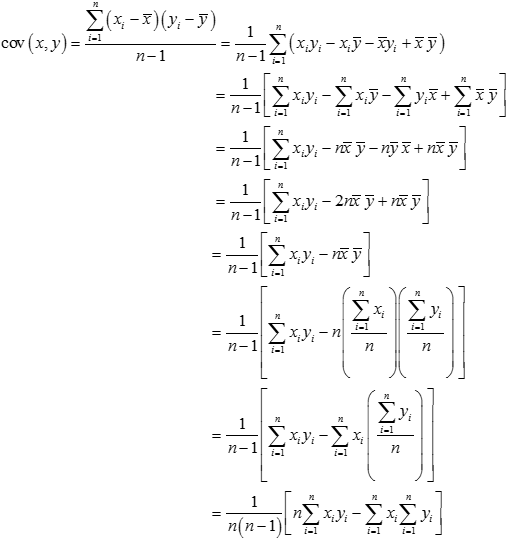
Therefore, Equation (18) can be represented as:
4. Result and Discussion
In this section, the research is performed to determine the long-term performance of share price according to market adjusted buy and hold return (MABHR) method and correlation analysis.
4.1 Classification of Companies According to MABHR Value
The calculation for MABHR is performed for companies that issue initial public offerings in the year of 2013.The classification of companies according to MABHR value is shown in Table 1. From Table 1, Solid Automotive Berhad gives the highest rate of return with respect to the market. This company is involved in trading and distribution of automotive components for worldwide market. The MABHR for Solid Automotive Berhad is 1.2528. This value indicates a positive gain.
Meanwhile, UMW Oil & Gas Corporation Berhad shows the lowest rate of return with respect to the market. The type of this company activity is in oil and gas service provider for Malaysia and international customers. The MABHR value is -0.7148. This value indicates negative return or loss.
Table 1: Classification of companies according to MABHR value
| No. | Company | Type of industry | MABHR | Return level |
| 1 | Solid Automotive Berhad | Trading and distribution of automotive components | 1.2528 | High return |
| 2 | Westports Holdings Berhad | Operator of Westports Malaysia | 0.8889 | |
| 3 | Matrix Concepts Holdings Berhad | Property developer | 0.4984 | Low return |
| 4 | ABM Fujiya Berhad | Vehicle Batteries Manufacturer | 0.2960 | |
| 5 | Titijaya Land Berhad | Housing Developer | 0.2759 | |
| 6 | Berjaya Auto Berhad | Mazda car distributor | 0.2445 | |
| 7 | Caring Pharmacy Group Berhad | Pharmacy Retailer | -0.1392 | Negative return
(loss) |
| 8 | Kanger International Berhad | Bamboo flooring producer | -0.1909 | |
| 9 | Barakah Offshore Petroleum Berhad | Oil and Gas service provider | -0.4181 | |
| 10 | UMW Oil and Gas Corporation Berhad | Oil and Gas service provider | -0.7148 |
4.2. Dynamic Behavior of Buy and Hold Return (BHR) Value
In this section buy and hold return is illustrated in graph to show the dynamic behavior of buy and hold return (BHR) value. Then, three companies are selected for buy and hold return (BHR) dynamic movement comparison. From Table 1, Westports Holdings Berhad is selected among companies with high return level. Next, ABM Fujiya Berhad is selected among companies with low return level. Then, UMW Oil and Gas Corporation Berhad is selected among companies with negative return level.
Figure 1 shows the dynamic behavior of buy and holds return (BHR) for Westport's Holding Berhad. The value of BHR is 1.00 at the first month and increasing to become 1.81 in the 36th month. There is a high increment of BHR value that contributes to high return for every share price.
Figure 2 shows the dynamic behavior of buy and hold return (BHR) for Matrix Concepts Holding Berhad. The value of BHR is 1.05 at the first month and increasing to become 1.42 in the 36th month. There is a moderate increment of BHR value that contributes to moderate return for every share price.
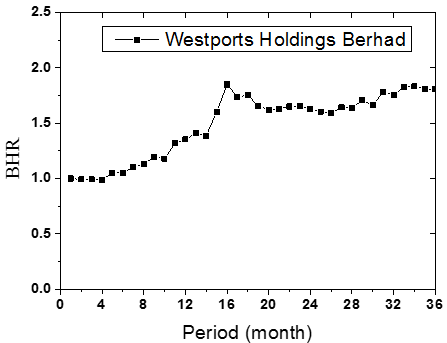
Figure 1: BHR dynamic behavior for Westports Holdings Berhad (High positive return category)
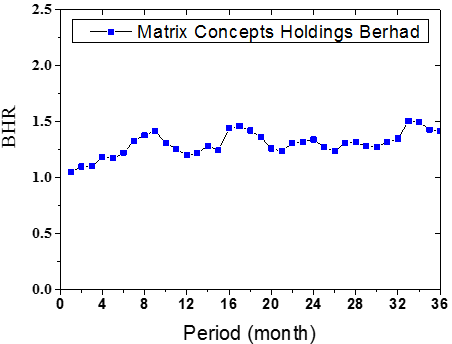
Figure 2: BHR dynamic behavior for Matrix Concepts Holdings Berhad (Low positive return category)
Figure 3 shows the dynamic behavior of buy and hold return (BHR) for UMW Oil and Gas Corporation Berhad. The value of BHR is 1.04 at the first month and decreasing to become 0.20 in the 36th month. There is high decrement of BHR value that contributes to high loss for every share price.
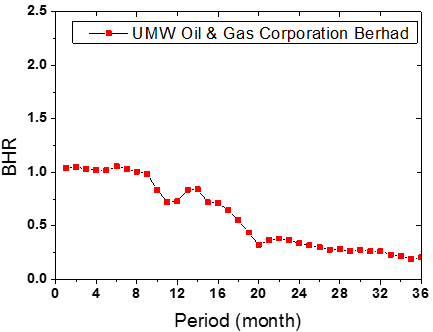
Figure 3: BHR dynamic behavior for UMW Oil and Gas Corporation Berhad (Negative return category)
4.3 Normality Checking for Return and Volatility Data
In this section, this research checks the normality status for return and volatility data for three companies that are Westports Holdings Berhad, Matrix Concepts Holdings Berhad, and UMW Oil and Gas Corporation Berhad.
a. Westports Holdings Berhad
Figure 4 is the histogram for return for a share price of Westport Holdings Berhad. The mean value is 2.32% and the standard deviation is 0.768%. Then, Figure 5 shows normal probability plot of return data for Westport Holdings Berhad. Both of graphs show a normal distribution of data.
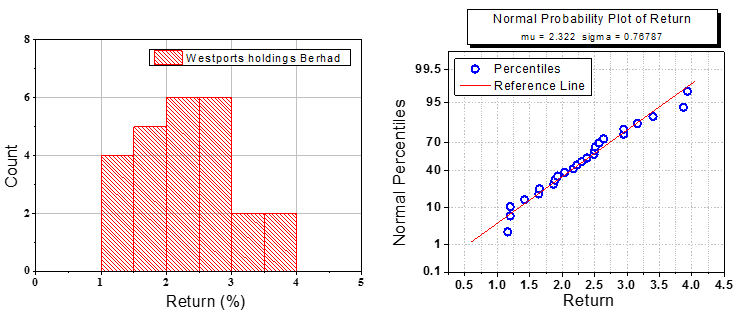
Figure 4: Histogram for return of share price Figure 5: Normal probability plot for return
This research verified the finding in Figure 4 and Figure 5 with performing normality test of Shapiro-Wilk test. Table 2 shows the p-value for Shapiro-Wilk test is 0.455, this value is more than 0.05. The distribution of data failed to reject the null hypothesis of Shapiro-Wilk test. Therefore, the data distribution for return is a normal distribution. In determining the normality of data distribution, this research omitted outliers that do not change the results but does affect assumptions.
Table 2: Tests of Normality
| Kolmogorov-Smirnova | Shapiro-Wilk | |||||
| Statistic | df | Sig. | Statistic | df | Sig. | |
| return | .099 | 25 | .200* | .962 | 25 | .455 |
Figure 6 is the histogram for volatility for share price of Westport Holdings Berhad. The mean value is 2.29 and standard deviation is 0.747. Then, Figure 7 shows normal probability plot of return data for Westport Holdings Berhad. Both of the graphs show a normal distribution of data. This research verified the finding with performing normality test of Shapiro-Wilk test. Table 3 shows the p-value for Shapiro-Wilk test is 0.300, this value is more than 0.05. The distribution of data failed to reject the null hypothesis of Shapiro-Wilk test. Therefore, the data distribution for return is a normal distribution. In determining the normality of data distribution, this research omitted outliers that do not change the results but does affect assumptions
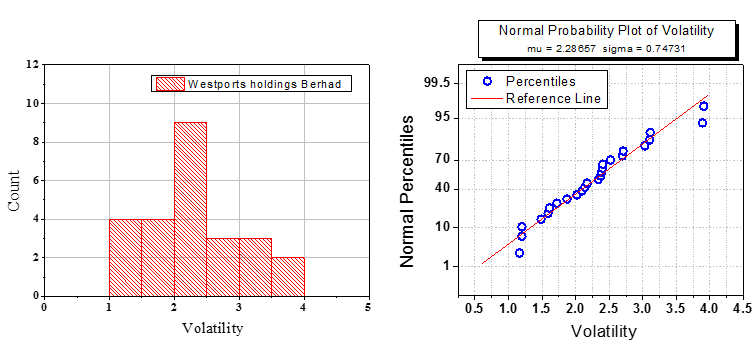 Figure 6: Histogram for volatility of share price Figure 7: Normal probability plot for volatility
Table 3: Tests of Normality
| Kolmogorov-Smirnova | Shapiro-Wilk | ||||||
| Statistic | df | Sig. | Statistic | df | Sig. | ||
| volatility | .118 | 25 | .200* | .953 | 25 | .300 | |
b. Matrix Concepts Holdings Berhad
Figure 8 is the histogram for return for share price of Matrix Concepts Holdings Berhad. The mean value is 2.48% and standard deviation is 0.731%. Then, Figure 9 shows normal probability plot of return data for Matrix Concepts Holdings Berhad. Both of the graphs show a normal distribution of data. This research verified the finding with performing normality test of Shapiro-Wilk test. Table 4 shows the p-value for Shapiro-Wilk test is 0.456, this value is more than 0.05. The distribution of data failed to reject the null hypothesis of Shapiro-Wilk test. Therefore, the data distribution for return is a normal distribution. In determining the normality of data distribution, this research omitted outliers that do not change the results but does affect assumptions.
Figure 10 is the histogram for volatility for the share price of Matrix Concepts Holdings Berhad. The mean value is 2.42% and the standard deviation is 0.659. Then, Figure 11 shows normal probability plot of return data for Matrix Concepts Holdings Berhad. Both of graphs show a normal distribution of data. This research verified the finding with performing normality test of Shapiro-Wilk test. Table 5 shows the p-value for Shapiro-Wilk test is 0.453, this value is more than 0.05. The distribution of data fails to reject the null hypothesis of Shapiro-Wilk test. Therefore, the data distribution for return is a normal distribution. In determining the normality of data distribution, this research omitted outliers that do not change the results but does affect assumptions.

Figure 8: Histogram for volatility of share price Figure 9: Normal probability plot for volatility
Table 4: Tests of Normality
| Kolmogorov-Smirnova | Shapiro-Wilk | |||||
| Statistic | df | Sig. | Statistic | df | Sig. | |
| Return | .110 | 26 | .200* | .963 | 26 | .456 |
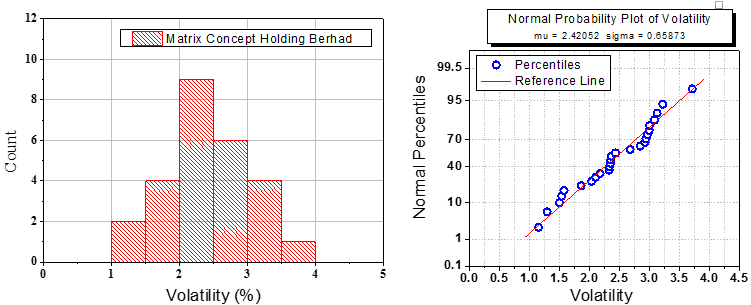
Figure 10: Histogram for volatility of share price Figure 11: Normal probability plot for volatility
Table 5: Tests of Normality
| Kolmogorov-Smirnova | Shapiro-Wilk | |||||
| Statistic | df | Sig. | Statistic | df | Sig. | |
| Volatility | .126 | 26 | .200* | .963 | 26 | .453 |
c. UMW Oil and Gas Corporation Berhad
Figure 12 is the histogram for return for the share price of UMW Oil & Gas Corporation Berhad. The mean value is -2.58% and the standard deviation is 1.073%. Then, Figure 13 shows normal probability plot of return data for UMW Oil & Gas Corporation Berhad. Both of graphs show a normal distribution of data. This research verified the finding with performing normality test of Shapiro-Wilk test. Table 6 shows the p-value for Shapiro-Wilk test is 0.074, this value is more than 0.05. The distribution of data failed to reject the null hypothesis of Shapiro-Wilk test. Therefore, the data distribution for return is a normal distribution. In determining the normality of data distribution, this research omitted outliers that do not change the results but does affect assumptions.
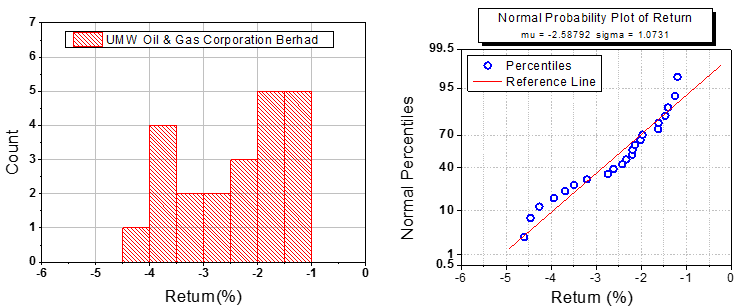
Figure 12: Histogram for return of share price Figure 13: Normal probability plot for return
Table 6: Tests of Normality
| Kolmogorov-Smirnova | Shapiro-Wilk | |||||
| Statistic | df | Sig. | Statistic | df | Sig. | |
| Return | .150 | 22 | .200* | .919 | 22 | .074 |
Figure 14 is the histogram for volatility for share price of UMW Oil and Gas Corporation Berhad. The mean value is -2.46% and standard deviation are 1.000. Then, Figure 15 shows normal probability plot of return data for UMW Oil and Gas Corporation Berhad. Both of graphs show a normal distribution of data. This research verified the finding with performing normality test of Shapiro-Wilk test. Table 7 shows the p-value for Shapiro-Wilk test is 0.053, this value is more than 0.05. The distribution of data fails to reject the null hypothesis of Shapiro-Wilk test. Therefore, the data distribution for return is a normal distribution. In determining the normality of data distribution, this research omitted outliers that do not change the results but does affect assumptions.
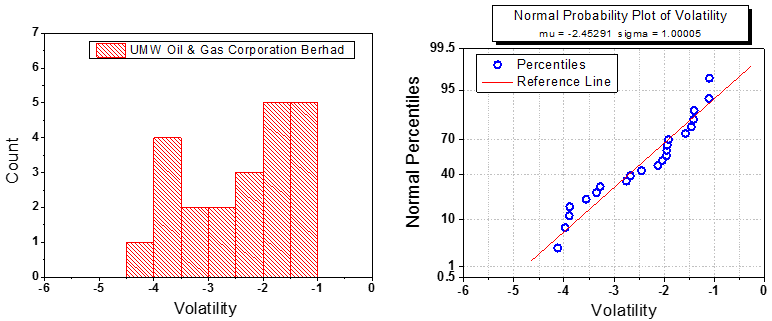
Figure 14: Histogram for volatility of share price Figure 15: Normal probability plot for volatility
Table 7: Tests of Normality
| Kolmogorov-Smirnova | Shapiro-Wilk | |||||
| Statistic | df | Sig. | Statistic | df | Sig. | |
| Volatility | .173 | 22 | .085 | .912 | 22 | .053 |
4.4 Correlation Analysis between Return and Volatility Using Pearson Correlation Analysis
In this section, this research shows the correlation result between return and volatility for three companies which are Westports Holdings Berhad (High return company), Matrix Concepts Holdings Berhad (Low return company) and UMW Oil and Gas Corporation Berhad (negative return company).
a. Westports Holdings Berhad
Figure 16 shows the correlation analysis between return and volatility of share price for Westports Holding Berhad. This company is selected as one of the companies that contribute the high return for every share price. The data in Figure 16 is fitted to a linear relationship. Therefore, the linear fit line for this graph is described in Equation (1).
Return = (1.01386) [Volatility] + 0.00375 (1)
A Pearson product-moment correlation was run to determine the relationship between volatility and return for the share price in long term performance. Table 10 shows the result of Pearson correlation analysis. The p-value of correlation is 0.000. This value rejected the null hypothesis of Person correlation analysis. Therefore, there is a significant correlation between volatility and return for the share price in long term performance. Next, the Pearson’s correlation coefficient, r, is 0.987. This value implies there is a strong positive association between volatility and return for the share price in long term performance. As a conclusion, there was a strong, positive correlation between volatility and return for share price in long-term performance, which was statistically significant (r = .987, n = 25, p = .000).
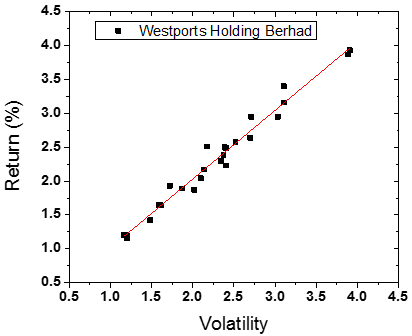
Figure 16: Correlations analysis of volatility and return for UMW Oil & Gas Corporation Berhad
Table 8: Pearson Correlation Test
| Return | ||
| Volatility | Pearson Correlation | .987 |
| Sig. (2-tailed) | .000 | |
| N | 25 | |
a. Matrix Concepts Holdings Berhad
Figure 16 shows the correlation analysis between return and volatility of share price for Westport's Holding Berhad. This company is selected as one of the companies that contribute the high return for every share price. The data in Figure 16 is fitted to a linear relationship. Therefore, the linear fit line for this graph is described in Equation (2).
Return = (1.07428) [Volatility] - 0.12024 (2)
A Pearson product-moment correlation was run to determine the relationship between volatility and return for share price in long-term performance. Table 10 shows the result of Pearson correlation analysis. The p-value of correlation is 0.000. This value rejected the null hypothesis of Person correlation analysis. Therefore, there is a significant correlation between volatility and return for share price in long-term performance. Next, the Pearson’s correlation coefficient, r, is 0.968. This value implies there is strong positive association between volatility and return for share price in long-term performance. As a conclusion, there was a strong, positive correlation between volatility and return for share price in long-term performance, which was statistically significant (r = .968, n = 26, p = .000).
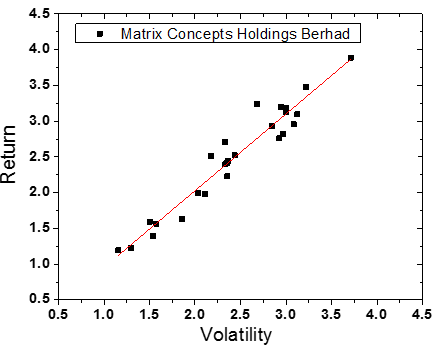
Figure 16: Correlations analysis of volatility and return for Matrix Concepts Holdings Berhad
Table 9: Pearson Correlation Test
| Return | ||
| Volatility | Pearson Correlation | .968 |
| Sig. (2-tailed) | .000 | |
| N | 26 | |
a. UMW Oil and Gas Corporation Berhad
Figure 16 shows the correlation analysis between return and volatility of share price for UMW Oil and Gas Corporation Berhad. This company is selected as one of the companies that contribute the negative return for the share price. The data in Figure 16 is fit to a linear relationship. Therefore, the linear fit line for this graph is described in Equation (3).
Return = (1.0336) [Volatility] - 0.0528 (3)
A Pearson product-moment correlation was run to determine the relationship between volatility and return for the share price in long-term performance. Table 10 shows the result of Pearson correlation analysis. The p-value of correlation is 0.000. This value rejected the null hypothesis of Person correlation analysis. Therefore, there is a significant correlation between volatility and return for the share price in long-term performance. Next, the Pearson’s correlation coefficient, r, is 0.963. This value implies there is a strong positive association between volatility and return for the share price in long-term performance. As a conclusion, there was a strong, positive correlation between volatility and return for share price in long-term performance, which was statistically significant (r = .963, n = 22, p = .000).
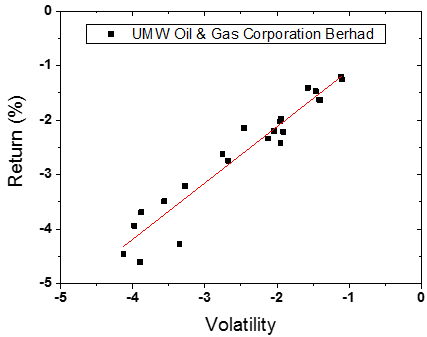
Figure 16: Correlations analysis of volatility and return for UMW Oil & Gas Corporation Berhad
Table 10: Correlations analysis
| Return | ||
| Volatility | Pearson Correlation | .963 |
| Sig. (2-tailed) | .000 | |
| N | 22 | |
4. Conclusion
This research is focused on the long-term performance of share price for companies listed in the year of 2013. All of these companies fulfill the requirement as Sharia-compliant Company. The objective of this research is to determine the long-term performance of share price according to market adjusted buy and hold return (MABHR) method and correlation analysis. This research is focusing on three companies which are Westports Holdings Berhad is selected among companies with high return level, ABM Fujiya Berhad is selected among companies with low return level, and UMW Oil and Gas Corporation Berhad is selected among companies with negative return level.
The main findings of this research are:
(i) The calculation for MABHR is performed for 10 companies that issue initial public offerings in the year of 2013. Solid Automotive Berhad gives the highest rate of return with respect to market. Meanwhile, UMW Oil and Gas Corporation Berhad shows the lowest rate of return with respect to the market.
(ii) The data distribution for return and volatility of Westport Holdings Berhad are following the normal distribution. There was a strong, positive correlation between volatility and return for the share price in long-term performance, which was statistically significant (r = .987, n = 25, p = .000).
(iii) The data distribution for return and volatility of Matrix Concepts Holdings Berhad are following the normal distribution. There was a strong, positive correlation between volatility and return for share price in long-term performance, which was statistically significant (r = .968, n = 26, p = .000).
(iv) The data distribution for return and volatility of UMW Oil and Gas Corporation Berhad are following the normal distribution. There was a strong, positive correlation between volatility and return for share price in long-term performance, which was statistically significant (r = .963, n = 22, p = .000).
The finding of this research helps economists to understand the market trend in empirical thinking. In addition, it also helps the investors to understand the market and make the right decision in investing during this challenging situation.
5. Further Research
The further research of this research will look into the determinant factors that contribute to the volatility of share price for the company listed on Malaysia Stock Exchange.
References
- Abu Bakar, N. and Rosbi, S. (2016) Long Term Performance of Islamic Share Price for Initial Public Offerings (IPOs) in Malaysia: Evidence from Sharia-Compliant Companies Listed on the Malaysian Stock Exchange (2006-2010), International Journal of Management Science and Business Administration, 2, Iss. 6, pp. 43-57
- Ahmad–Zaluki, N. A, Campbell, K. and Goodacre, A. (2007) The Long Run Share Price Performance of Malaysian Initial Public Offerings (IPOs) Journal of Business and Accounting, Vol. 34, No. 1, pp. 78–110
- Ahmad-Zaluki, N.A. and Boon Kect, L., (2012), The investment performance of MESDAQ market Initial Public Offerings (IPOs) Asian Academy of Management Journal of Accounting and Finance, Vol. 8, No.1, pp. 1-23
- Becketti, S. and Sellon, G. (1989), “Has financial market volatility increased?”, Economic Review, May/June, No. 3, pp. 17-30
- Boonvorachote, T. and Lakmas, K. (2016) Price volatility, trading volume, and market depth in Asian commodity futures exchanges, Kasetsart Journal of Social Science, Vol. 37, Iss. 1, pp. 53-58
- Chen, C. and Wang, X., (2016), The impact of the reputation of underwriter and sponsoring representative on IPO underwriting fees, China Finance Review International, Vol. 6 Iss. 4 pp. 342 – 366
- Corhay, A., Teo, S. and Rad, A.T. (2002), The long run performance of Malaysian initial public offerings (IPO): value and growth effects, Managerial Finance, Vol. 28 Iss. 2 pp. 52 – 65
- Chen, A., Chen, L.W. and Kao, L. (2010), Leverage, liquidity and IPO long-run performance: evidence from Taiwan IPO markets, International Journal of Accounting and Information Management, Vol. 18 Iss. 1 pp.31 – 38
- Drobetz, W., Kammermann, M. and Walchle, U. (2005) Lon–run performance of Initial Public Offerings: The evidence for Switzerland, Schmalenbach Business Review, Vol. 57, pp.253–275
- Darani, E.H. (2012) Corporate Governance, IPO (Initial Public Offering) Long Term Return in Malaysia, 2012 International Conference on Economics, Business and Marketing Management, Singapore, Vol. 29
- Escobari, D. and Serrano, A., (2016), Reducing asymmetric information in venture capital backed IPOs, Managerial Finance, Vol. 42 Iss. 6 pp. 553 – 568
- Floros, C. and Enrique Salvador, E (2016)," Volatility, trading volume and open interest in futures markets , International Journal of Managerial Finance, Vol. 12 Iss 5 pp. 629 – 653
- Faff, R.W. and McKenzie, M.D., (2007), The relationship between implied volatility and autocorrelation, International Journal of Managerial Finance, Vol. 3 Iss. 2 pp. 191 – 196
- Goergen, M., Khurshed, A. and Mudambi R., (2007), The long-run performance of UK IPOs: can it be predicted?, Managerial Finance, Vol. 33 Iss. 6 pp. 401 – 419
- He, L., Cordeiro, J.J. and Shaw, T.S., (2015), CEO power, equity ownership and underwriter reputation as determinants of lockup period length, Management Research Review, Vol. 38 Iss. 5 pp. 438 – 458
- Islam, A., Ali, R., and Ahmad, Z. (2010), An Empirical Investigation of the Underpricing of Initial Public Offerings in the Chittagong Stock Exchange. International Journal of Economics and Finance, 2(4) 36–46
- Ismal, R. (2010), Volatility of the returns and expected losses of Islamic bank financing, International Journal of Islamic and Middle Eastern Finance and Management, Vol. 3 Iss 3 pp. 267 – 279
- Kooli, M. and Suret, J. (2004), The aftermarket performance of initial public offerings in Canada, Journal of Financial Management. Vol. 14, pp. 47–66
- Tan, Y. and Floros, C. (2012), Stock market volatility and bank performance in China, Studies in Economics and Finance, Vol. 29 Iss 3 pp. 211 – 228


